MailBag October 31, 2014 at 08:06 AM
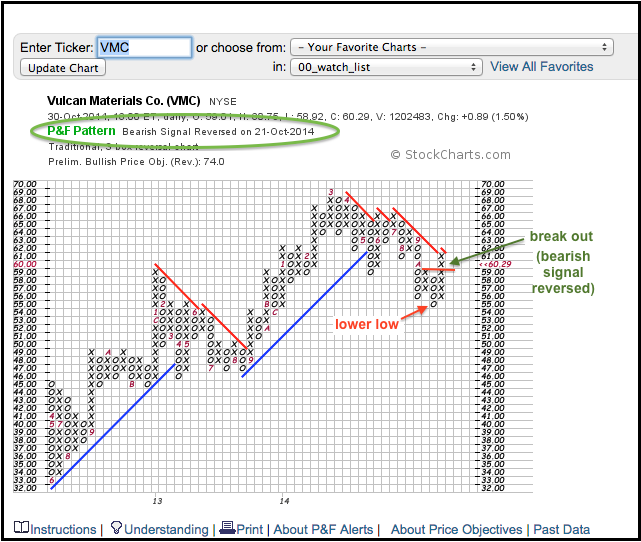
A bearish signal reversed is a bullish P&F signal that suddenly occurs after a series of lower lows and lower highs. First, a P&F downtrend needs to be present on the chart. Note that X-Columns represent rising prices and O-Columns represent falling prices. A downtrend is present when successive X-Columns fail to exceed the high of the prior X-Column and O-Columns form lower lows. The bearish signal reversed signal occurs when the current X-Column surges above the prior X-Column to reverse this downtrend. The chart above shows Read More
MailBag October 24, 2014 at 06:17 AM
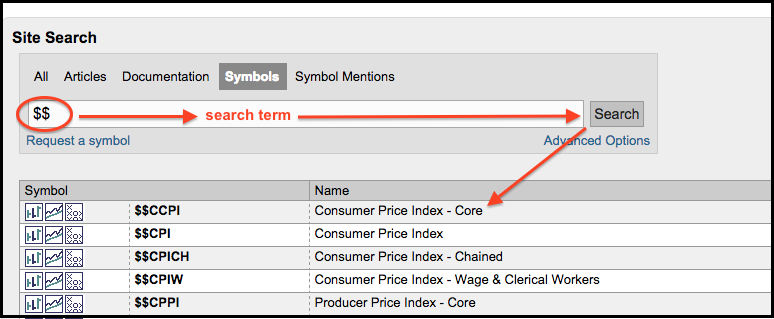
In addition to stocks, ETFs and Mutual Funds, StockCharts provides data for hundreds of indexes and market indicators as well as dozens of economic indicators and futures contracts. The index and indicator symbols are prefixed with a Dollar sign or an exclamation point. Examples include $SPX for the S&P 500 or !GT200SPX for the Percentage of $SPX Stocks above their 200-day EMA. Symbols for futures contracts are prefixed with a caret. Examples include ^CLZ14 for December Light Crude and ^GCZ14 for December Gold. Symbols for economic indicators begin with two Dollar signs. Examples Read More
MailBag October 17, 2014 at 11:56 AM
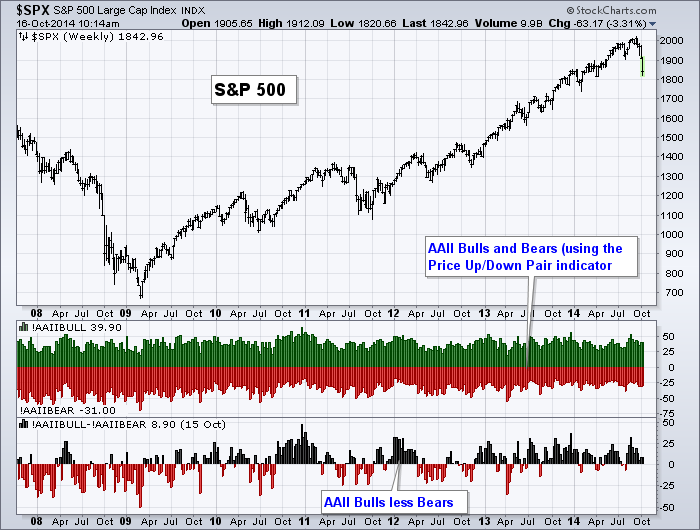
With the DecisionPoint merger, StockCharts acquired several sentiment indicators with long histories. Sentiment indicators measure the bullishness or bearishness of a particular group. These indicators are often used as contrarian indicators to identify market extremes. Excessive bullish sentiment is viewed as potentially bearish for the stock market, while excessive bearish sentiment is viewed a potentially bullish. Chartists can plot these indicators separately or plot the difference between bulls and bears. StockCharts provides sentiment data from the American Association of Individual Read More
MailBag October 10, 2014 at 06:00 AM
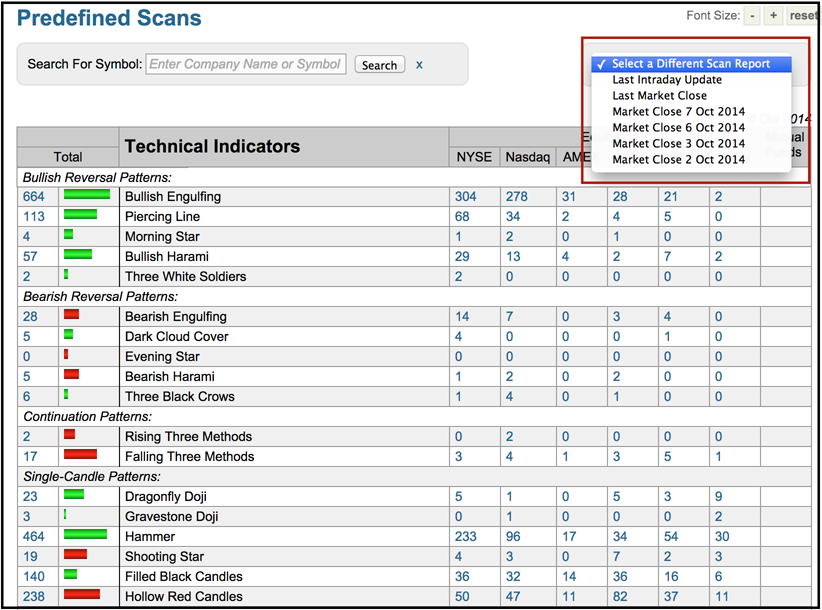
The stock market pulled off a big intraday reversal on Wednesday and many stocks formed bullish engulfing patterns. There were 304 on the NYSE and 278 on the Nasdaq. Chartists can find these stocks using the Predefined Scans Page, but Wednesdays' results are not immediately visible because the default page will show the most recent scan results. StockCharts users can access prior results with the click of the mouse. Simply go to the dropdown menu in the upper right, which is entitled "Select a Different Scan Report". Users can view the last intraday update, the last close or pick a Read More
MailBag October 03, 2014 at 05:15 AM
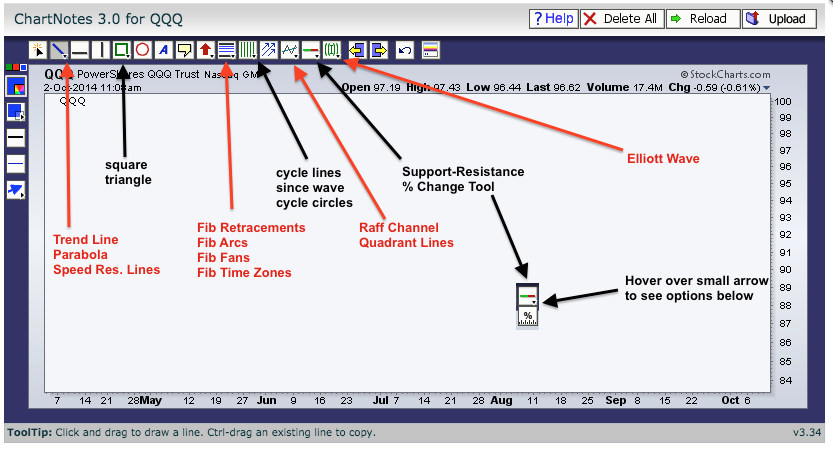
When annotating a SharpChart, there is a row of icons at the top of the ChartNotes workbench. Chartists can hover over the icons that have a small arrow in the right corner to reveal "hidden" icons for more features. The chart below shows the ChartNotes workbench with the standard tool bar at the top. The Trendline icon is in the left corner and there are two other icons underneath it (Parabola and Speed Resistance Lines). Several other icons are also singled out to show the other tools available. For example, the Percent Change Tool can be found under the Auto Support-Resistance Read More