Step-by-Step February 05, 2009 at 10:37 PM
In order to get StockCharts.com to work properly, your web browser must be configured to accept all "web cookies" from our servers. If you are not using an Internet Privacy program, you'll need to check your browser's Privacy/Security settings to ensure that it is accepting our cookies correctly. For more information, please review this article: http://www.wikihow.com/Enable-Cookies-in-Your-Internet-Web-Browser If you are using an Internet Privacy program, you'll probably also need to add "stockcharts.com" to the program's "whitelist" so that it stops Read More
Step-by-Step February 03, 2009 at 06:49 PM
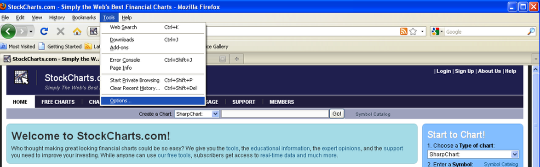
In order to get StockCharts.com to work properly, your web browser must be configured to accept all "web cookies" from our servers. Here are the steps for ensuring that your browser is properly configured Note: These are the steps for Firefox 3.x under Windows XP. Things may be slightly different for other computers. Open Firefox's "Options" box from the "Tools" menu if using Windows. After starting Firefox, open the "Tools" menu and click on the "Options" item at the bottom of Read More
Step-by-Step February 02, 2009 at 07:49 PM
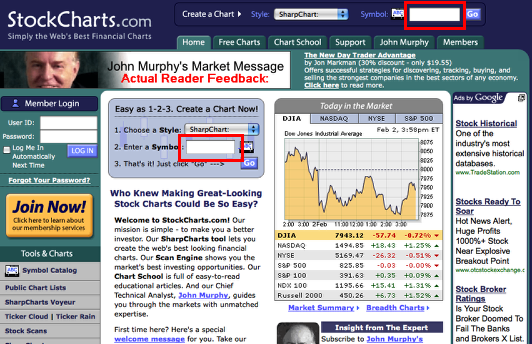
In this tutorial, we'll go over the basics of creating high-quality financial charts using SharpCharts, the main charting tool at StockCharts.com In this example, let's assume that we've just read a nice article about a company called "Hudson Technologies" and we'd like to examine their stock chart closely. Our first problem is that we need to find out what the ticker symbol for Hudson Technologies is, then we need to create a simple chart for it, then we need to start customizing the chart. Let's get started Read More
Step-by-Step February 02, 2009 at 03:50 PM
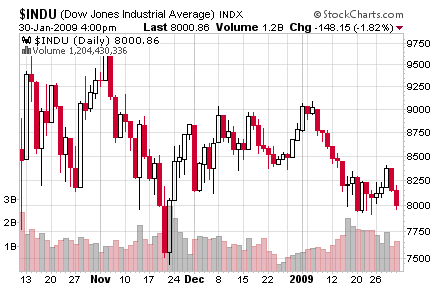
Most SharpCharts include a histogram at the bottom of the chart that represent the trading volume for each bar. Sometimes it is useful to add a moving average to those bars to see when unusual volume days occurs. Here are the steps to do that Start with a "Standard" SharpChart with overlaid volume To create this example, chart $INDU, then apply the "SCC Default" ChartStyle, then use both "Clear All" buttons to remove the overlays and indicators. (Or just click here) Read More