CHARTCON 2014 STARTS ON FRIDAY!
by Chip Anderson | ChartWatchers
Hello Fellow ChartWatchers!
ChartCon week is finally here! Here's a visual representation of what that means for me currently:

That's a picture of me currently - overworked and overwhelmed and without any of my hair!
I'll be honest - pulling together all of the loose ends that go into holding a successful conference is a ton of work. Fortuntately I have several great people helping me out (THANKS!).
Even so, I am too swamped to write a proper article this week. Fortunately John and Art and Greg and Erin and Tom have all stepped up to fill in for me. Scroll down for their thoughts on the crazy market action last week.
If you are coming to ChartCon 2014, I will see you on Friday. It will be a terrific event! (You have seen the speaker lineup haven't you?)
See you in Seattle!
- Chip
SITE NEWS
RECENT ADDITIONS TO STOCKCHARTS.COM
- NEW DOCUMENTATION AREA ALMOST COMPLETE! - We're continuing to populate our new Documentation area with updated articles on all the various features of our various tools. Everyone who uses StockCharts.com owes it to themself to review this new information soon. Even old-timers will probably learn a thing or two. If you find a problem with any of the articles, please let us know so we can fix it. Thanks!
- WATCH OUT FOR SEVERAL BIG ANNOUNCEMENTS DURING CHARTCON - During the last two ChartCons, we announced the addtion of several important new features to the website. There no reason the believe we won't do the same thing this year...
- Did you watch Martin Pring's latest video?
VIX JUMPS TO FOUR-MONTH HIGH
by John Murphy | The Market Message
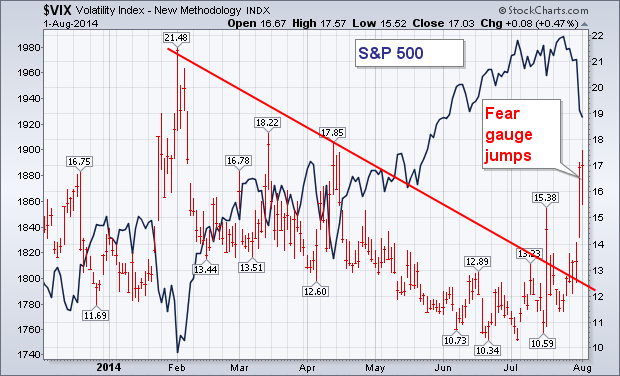
As usually happens when stocks weaken, the CBOE Volatility (VIX) Index jumped sharply this week to the highest level since April. The VIX (also called the "fear gauge") has climbed 47% since the start of July. That means that traders are buying "option" insurance against a possible downturn in stocks. The red bars in Chart 10 show that the recent upturn in the VIX is the biggest since January. That's consistent with a short-term correction. A move above its spring highs, however, (18.22 and 17.85) would be more cause for concern. Generally speaking, VIX closes much above 20 often signal a major downside stock correction, while moves above 40 usually mark major bottoms. The last time a decisive VIX move above 20 triggered a major correction was between July and October 2011, when the S&P 500 lost nearly 20%. Stocks bottomed that October with the VIX peaking at 48. [I pointed out earlier this year that downside corrections ending in October are also common during midterm election years -- like 2014]. That doesn't guarantee that a similar pattern will form this year, but seasonal and historical tendencies shouldn't be ignored. To quote Mark Twain: "History doesn't repeat itself, but it rhymes."
See you in Seattle,
John
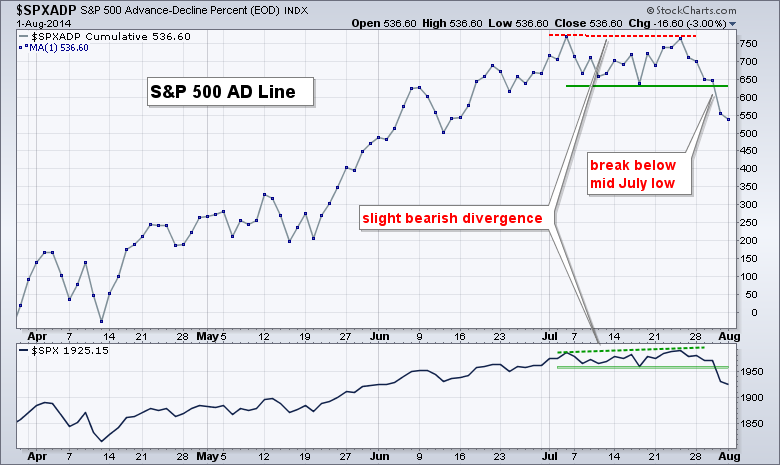
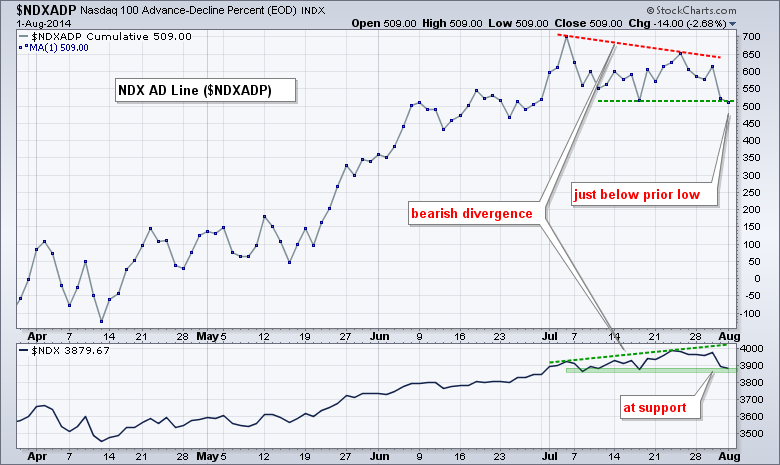
While the S&P 500 and Nasdaq 100 moved to new highs in late July, their respective AD Lines did not follow suit and formed small bearish divergences. The lower highs in the AD Lines indicate that breadth did not keep up with the underlying indices, which suggests narrowing participation.
The first chart shows the S&P 500 AD Line ($SPXADP) forming a slightly lower high last week and breaking below the mid July low with a sharp decline. The indicator window shows the S&P 500 breaking below its July lows as well. This means both the AD Line and the index are in short-term downtrends. The bearish divergence only spans a few weeks and I would not consider it a long-term issue. A bearish divergence that spans two or more months would be more significant.
The second chart shows the Nasdaq 100 AD Line ($NDXADP) forming a lower high and moving below the mid July low. Notice that this bearish divergence is a little more pronounced than that of the S&P 500 AD Line because the red trend line is steeper. With a break below the mid July low, the Nasdaq 100 AD Line is in a short-term downtrend and this could foreshadow weakness in the Nasdaq 100 (and QQQ).
See you in Seattle!
Arthur Hill, CMT
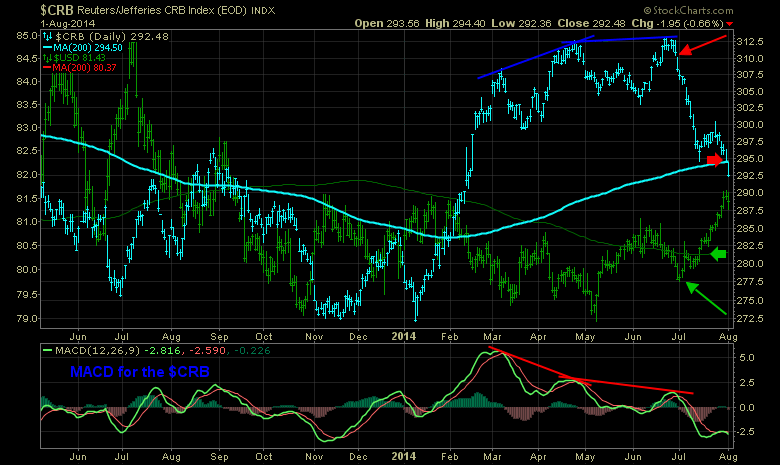
The Commodity Research Bureau Index ($CRB) has had a very volatile year. Just when the trend looked to be accelerating, it rolled over. Lately, the US Dollar ($USD) started to accelerate on July 1 as pointed to by the long green arrow. The $CRB rolled over since then as denoted by the red arrow. We also saw the Russell 2000 ($RUT) top on the same day.
Now, when we look at the Energy SPDR (XLE) and Materials SPDR(XLB) it looks like they were just breaking down in the last few days based on Chart 2.
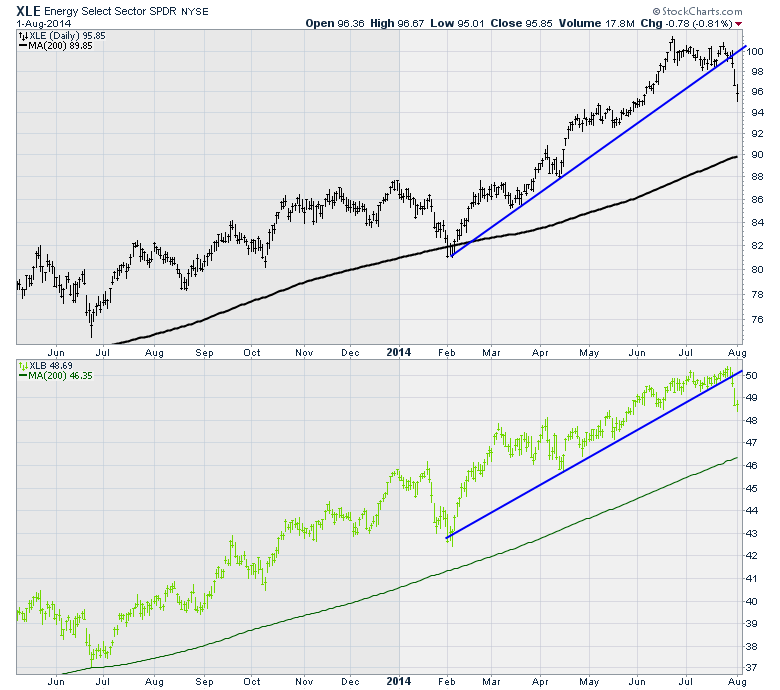
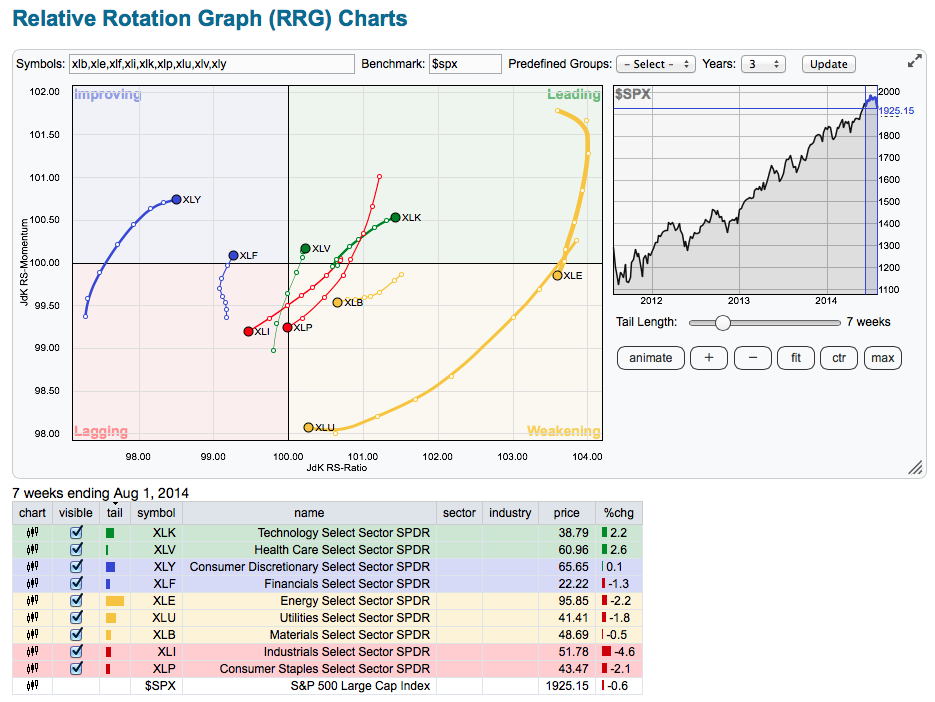
However, the weakness was building. A new tool on StockCharts.com would help us see this before the breakdown. Here is the RRG Chart tool on Chart 3 that Chip talked about in the last ChartWatchers newsletter.
Here is the link to the RRG chart for members. XLE and XLB. Notice how they have been weakening for 7 weeks. As the $USD accelerated it really put pressure on the sector for the last 4 weeks. Before the surge in the $USD, the price action was just moving sideways in price.
The bottom line is that the $USD looks to be going meaningfully higher as the rest of the currencies are all dropping in unison against the $USD right now.
This is a slippery slope for commodities. The sudden strength of the $USD would suggest that the primary direction for commodities and commodity related stocks is probably lower.
That includes Oil, Gold, Silver, Copper and Lumber related entities. We may have interim rallies, but the macro favours lower commodities and related stocks until we see some divergence on the the $USD. There is lots of resistance looking left for the $USD at 81.5 so we might get a short term breather here (left scale).
See you in Seattle!
Greg Schnell, CMT
We've been watching our DecisionPoint indicators very closely over the past week as they have moved into neutral and now oversold territory. All three time frames are technically bearish as the indicators continue to fall without bottoming. Carl had written about a minor selling spike in the DecisionPoint blog about a week ago. Thursday we got a major spike on our ultra-short-term and short-term indicators.
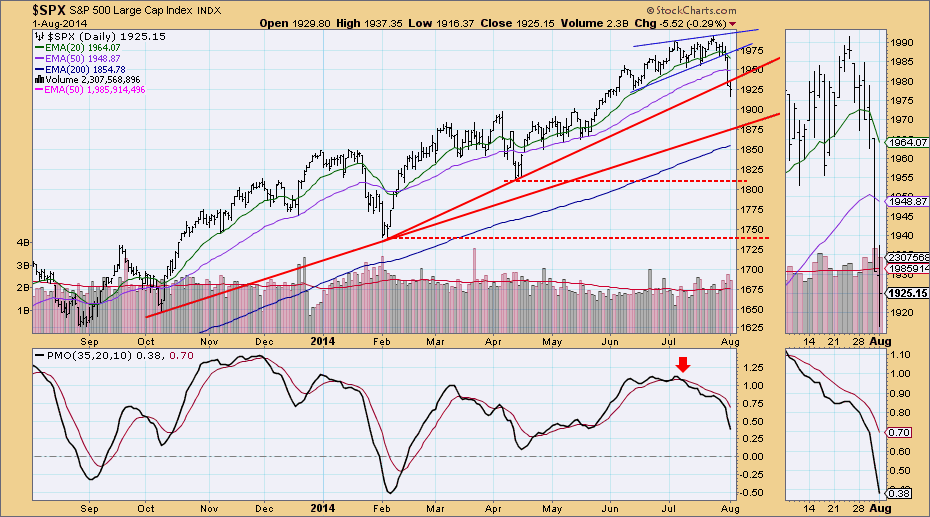
Looking at the chart below from the DecisionPoint Chart Gallery, you can see that Thursday price broke down out of the ultra-short-term bearish rising wedge and then on Friday longer-term support was broken. The next area of support would be at the support line drawn from the October low. That area of support isn't that far away, it would only require price to fall to around 1880. I've annotated possible follow-up support lines at the last two major lows. The PMO has been dropping since the negative crossover that gave us early warning while price was still in the rising wedge.
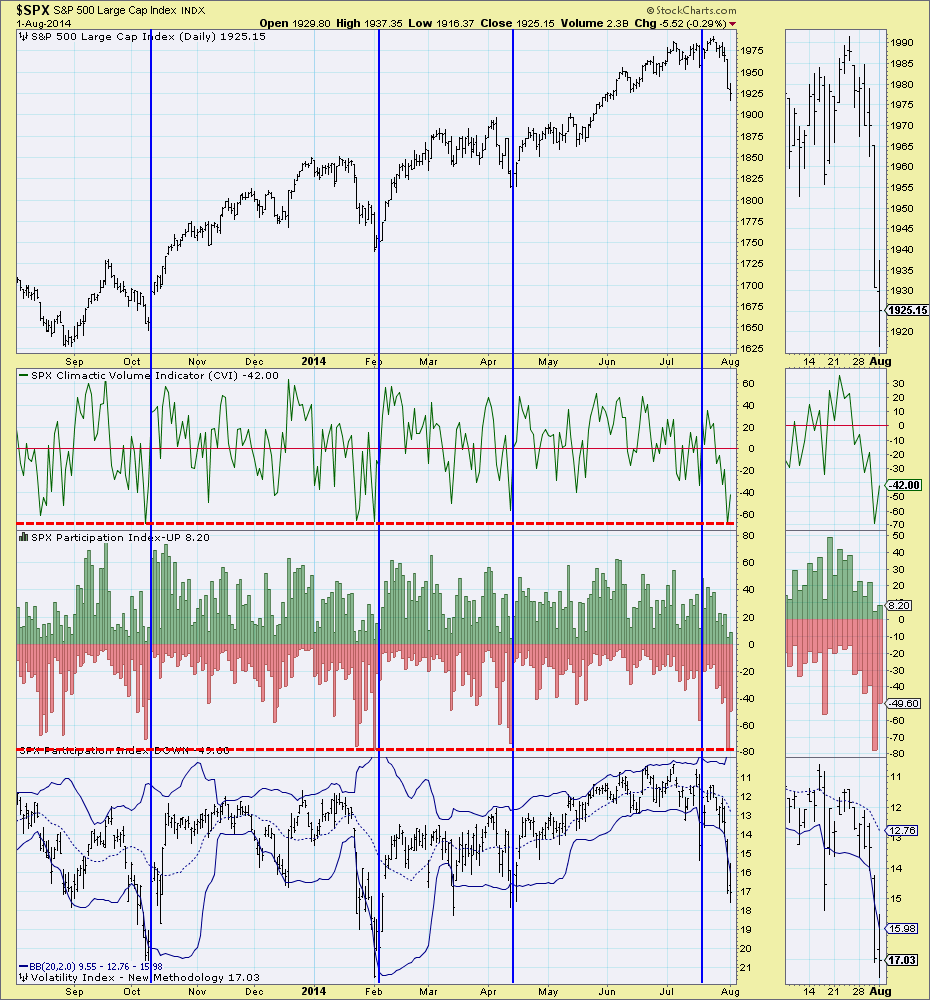
Ultra-short-term indicators all spiked on Thursday. Big spikes like this have two meanings. They are either exhaustion spikes, indicating selling (or buying) pressure has peaked. The other kind of spike, in my opinion, is an "Initiation event." If true, that indicates that this is 'only the beginning', expectation is price will continue in the direction that caused the spike. In this case, the initiation would be lower prices. What is interesting is that we saw the follow-through on that peak on Friday when prices continued lower and broke down through support. I think my main issue with this chart is the VIX. When it breaks down from the Bollinger Bands and ultra-short-term indicators have spiked, a bounce or subsequent rally has ensued.
Short-term indicators also had a spike, but it took until Friday. These indicators are still falling despite having hit oversold extremes. While this could represent an initiation situation also, I suspect we are going to see a snap back soon that will get these indicators to bottom.
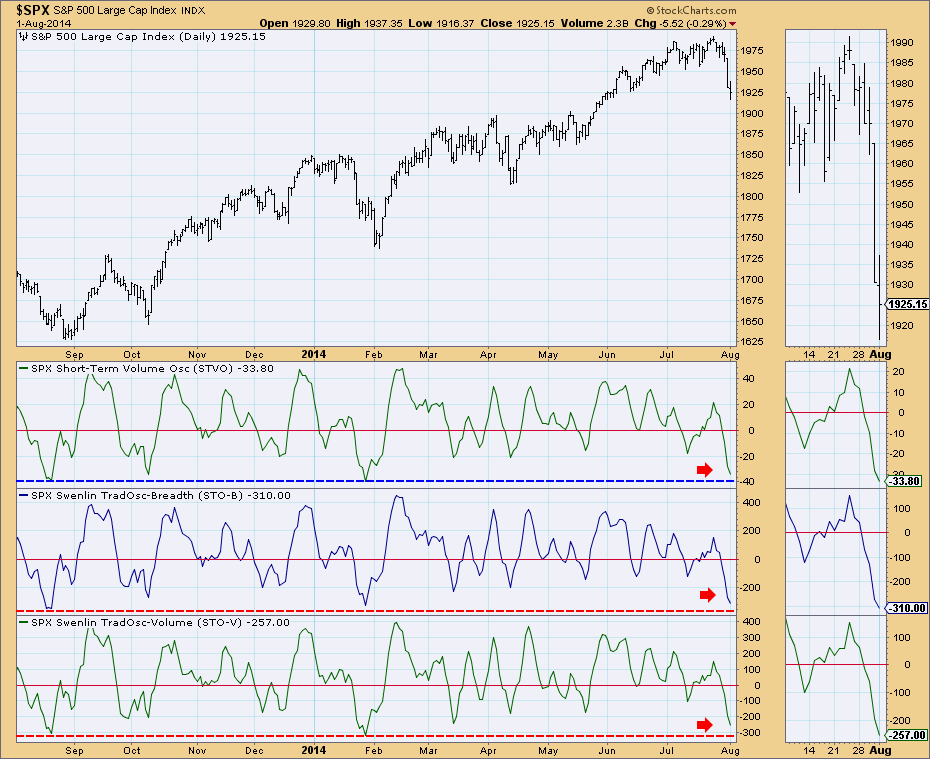
A bounce or snap back would likely be short-lived based on the intermediate-term indicators. Notice that they are falling and have passed through neutral territory, but have plenty of room to continue lower before reaching extremes.
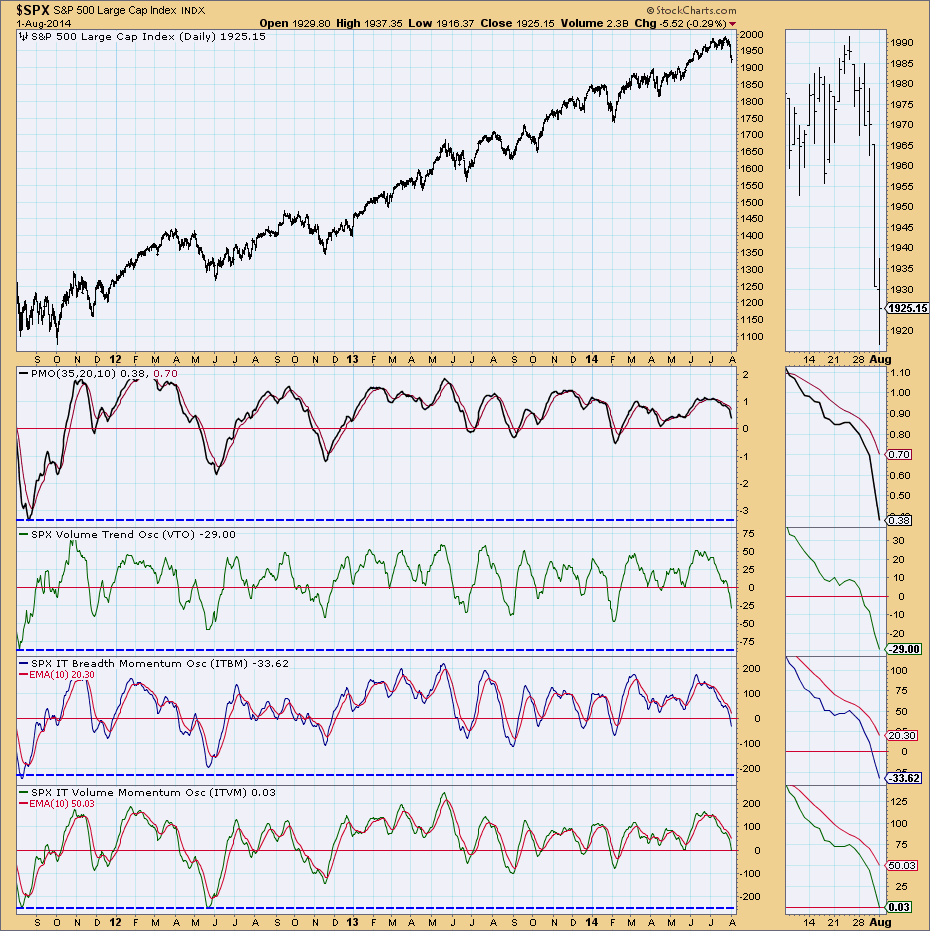
The DP Chart Gallery offers not only the charts above, but even more indicator charts for review. As a paid member, you can also view the same charts for the Dow, NDX and S&P 100. In conclusion, remember that the intermediate term affects the short term and the short term affects ultra-short term. While short-term indicators appear to have reached oversold extremes which is somewhat bullish, the intermediate-term indicators are still very bearish. A short snap back toward the area of failed support is possible, but intermediate-term are bearish enough that a rally or bounce should be short-lived.
See you in Seattle!
- Erin
Warning signs have piled up for months, but there have been few breakdowns to confirm all of these bearish signals. That changed last week as volume surged leading to breakdowns across many of our major indices, sectors and industry groups. One obvious problem was the S&P 500's inability to protect its 50 day SMA. Check out this 6 month chart:
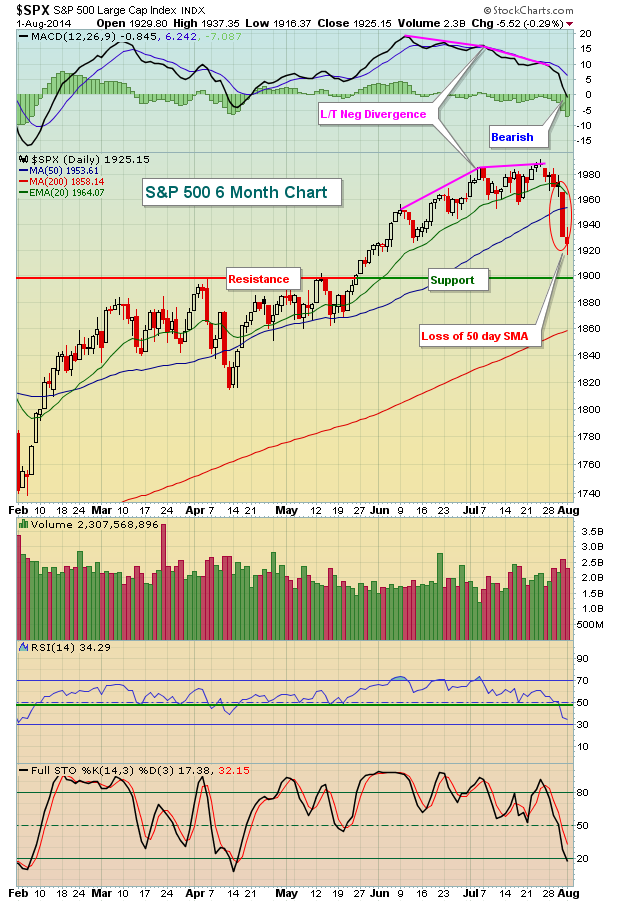
If you look back, you'll see that the S&P 500 surrendered its 50 day SMA in January and April, only to recover and extend its current bull market. But there is a difference this time. Many intermarket relationships began changing in March. Money shifted from aggressive areas of the market to defensive areas. That rotation kept the market afloat and even led to further gains in the S&P 500, but the gains - as I've stated on several occasions - have not been healthy gains, the kind that we can depend on to sustain the 5 1/2 year bull market.
The Russell 2000 has badly lagged the S&P 500 since March. Banks have done likewise. Among consumer stocks, discretionary names have taken a back seat to staples. These are all relationships that normally precede market weakness, not market strength. Think about it. If our economy were truly expected to strengthen, wouldn't you want to park your money in aggressive areas of the stock market, in companies whose bottom lines would benefit the most? Instead, market participants have been doing the opposite and taking a very defensive-minded approach to stocks.
Home construction stocks have been absolutely clobbered since June new home sales were reported on July 24th. If you recall, May new home sales were reported at the highest level in 6 years. But the June report revised those May sales SIGNIFICANTLY lower, then followed that up with a HUGE miss in June. The Dow Jones US Home Construction index ($DJUSHB) responded by falling 11% in 8 trading days, closing beneath key technical price support at 460 in the process. Here's the visual:
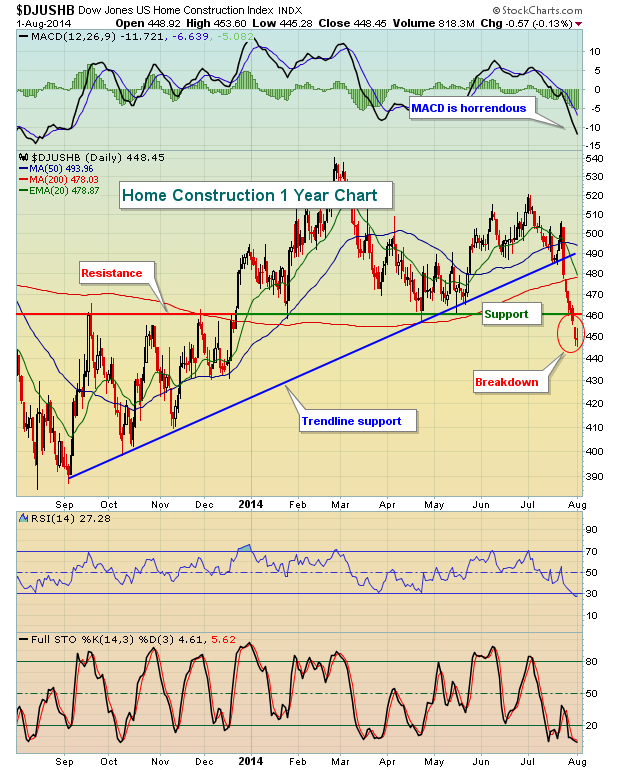
In the past 8 sessions, the DJUSHB has lost trendline support, short-term price support at 485, 20 day EMA support, 50 day SMA support and intermediate-term price support at 460. Buyers have disappeared - and all at a time when the 10 year treasury yield ($TNX) has been kept artificially low by the Federal Reserve. The TNX finished last week at 2.50% so higher interest rates aren't spooking homebuilders, so what is? That answer really doesn't matter to me, I only care that the breakdown and awful performance is occurring. The talking heads can debate why. Technicians don't ask "why" questions. They leave that to the fundamentalists, who usually arrive late to the party.
We're just beginning to see technical deterioration in the market. The biggest question is will it continue and how bad might it get? I just take it one sector and industry group at a time.
Software ($DJUSSW) failed to hold onto price support late last week and finished just beneath its 50 day SMA on Friday. One of its component stocks reports earnings on Monday after the bell and I've taken a look at the chart in my latest Earnings Preview at EarningsBeats.com. A bad report here could send software stocks spiraling lower as well. You can CLICK HERE to receive this chart for FREE.
See you in Seattle!
Tom Bowley
Chief Market Strategist/Chief Equity Strategist
Invested Central/Earnings Beats.com

Donald Trump was quoted as saying "Get going. Move forward. Aim high. Plan a takeoff. Change your attitude and gain some altitude. Believe me, you'll love it up here." I will admit that in the middle of summer, my passion for the markets ebbs. As I talk to my trading friends, I know I am not alone with respect to a summer slump. It's just human nature...
Read More


 Donald Trump was quoted as saying "Get going. Move forward. Aim high. Plan a takeoff. Change your attitude and gain some altitude. Believe me, you'll love it up here." I will admit that in the middle of summer, my passion for the markets ebbs. As I talk to my trading friends, I know I am not alone with respect to a summer slump. It's just human nature...