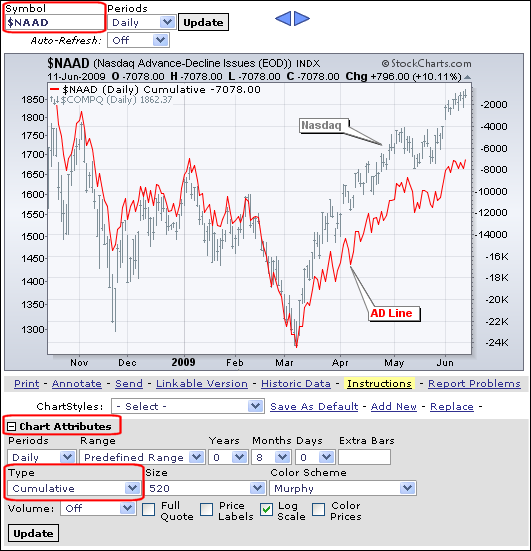
There are two steps to creating the AD Line. First, you need to know the symbol for net advances, which equals the number of advancing stocks less the number of declining stocks. $NAAD is the symbol for Nasdaq Net Advances and $NYAD is the symbol for NYSE Net Advances. Second, you need to select “Cumulative” as the chart “Type”. Under “Chart Attributes”, there is a drop-down menu for “Type”. This allows users to choose bars, candlesticks, line, area, cumulative and many other different plotting techniques. The chart below shows the AD Line for the Nasdaq. Red rectangles show the key places for chart configuration.
Cumulative means that each day’s figure is added to the prior day to form a line chart. The AD Line moves up when Net Advances are positive and down when Net Advances are negative. In the example above, I am showing the AD Line as a red line and the Nasdaq with gray bars behind the AD Line. This makes it easy to compare the performance of the AD Line with the Nasdaq. The cumulative setting can also be used for other breadth indicators, such as the AD Volume Line and cumulative Net New Highs. The symbols are shown below:
Net Advancing Volume - Nasdaq: $NYAD
Net Advancing Volume - NYSE: $NYUD
Net New Highs - Nasdaq: $NAHL
Net New Highs - NYSE: $NYHL


Posted by: mike barry June 12, 2009 at 14:43 PM
Posted by: David Ostby June 14, 2009 at 17:40 PM
Posted by: George Luciani June 16, 2009 at 14:07 PM
Posted by: Arthur Hill June 16, 2009 at 16:38 PM
Posted by: Claudio Boyks June 18, 2009 at 09:23 AM