MailBag August 28, 2009 at 10:04 AM
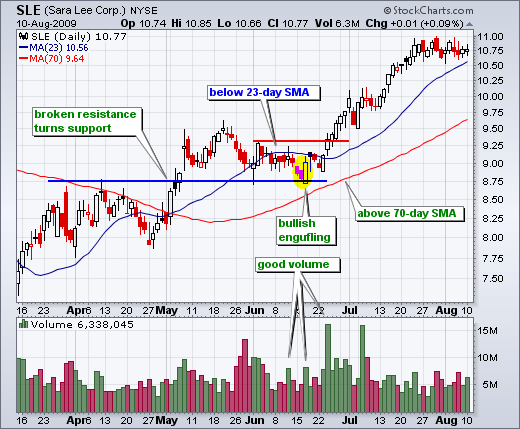
Most candlestick patterns form over 1-3 days, which makes them short-term patterns that are valid for 1-2 weeks. Hammers and shooting stars require just one day. Engulfing patterns, piercing patterns and dark cloud cover patterns require two days. Morning stars and evening stars require three days. Keep in mind that these candlestick patterns are trying to reverse an existing trend, usually a short-term trend that is a few weeks old. Bullish candlestick patterns form in short-term downtrends, while bearish candlestick patterns form in short-term uptrends. Do not expect a long-term trend Read More
MailBag August 21, 2009 at 10:06 AM
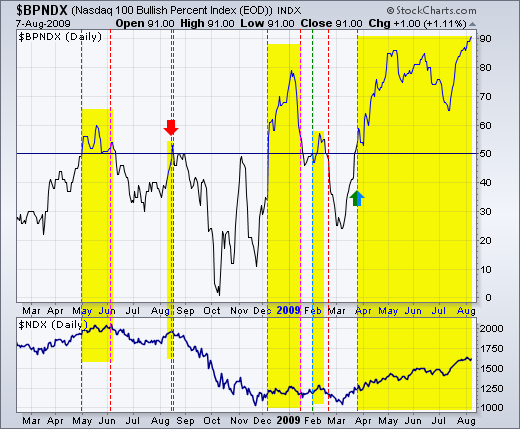
Bullish percent is a breadth indicator that shows the percentage of stocks in a given index with Point&Figure buy signals. If 60 of the 100 stocks in the Nasdaq 100 are on Point&Figure buy signals, then the bullish percent would be 60% (60/100 = .60 or 60%). Readings above 50% show general strength, while readings below 50% show general weakness. Because bullish percent oscillates above and below the 50% line, traders can also look for overbought/oversold conditions as well as positive/negative divergences. Click on this chart to see more details. The chart below shows Read More
MailBag August 17, 2009 at 04:18 PM
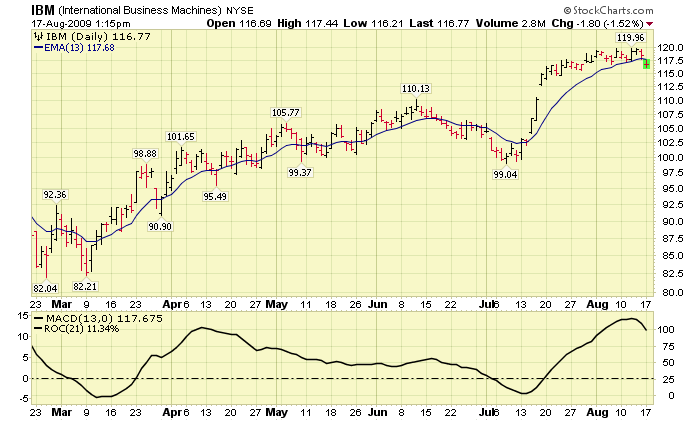
Great question from Randall came in today: "I have tried to create a Smoothed Rate of Change indicator on one of my charts with little success. I am trying to create a "Smoothed Rate of Change " indicator. As one of the options, you offer a ROC. To create a Smoothed Rate of Change (S-RoC 13/21) calculate a 13 day exponential moving average of closing prices and apply a 21-day Rate of Change to it. This indicator is from the "Trading for a Living" book by Alexander Elder. Is it possible to create this indicator using Stockcharts?" Yes, but right now you need to use a Read More
MailBag August 14, 2009 at 12:22 PM
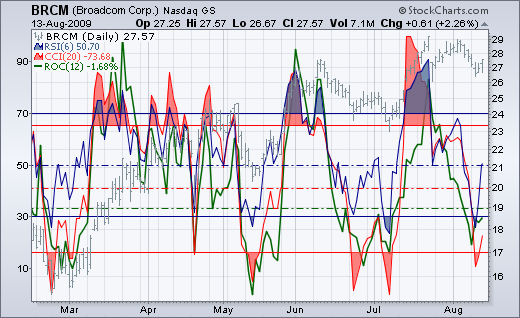
The choice of indicator depends on what you are trying to measure. Momentum is best measured with momentum oscillators like Rate-of-Change and MACD. Overbought/oversold levels are best measured with banded oscillators like Stochastics and RSI. Money flow is best measured with volume-based indicators such as On Balance Volume and the Accumulation Distribution Line. Trend is best measured with trend-following indicators like moving averages and Kelter Channels. Volatility is best measured by using Standard Deviation or Average True Range. There are even a few hybrids that combine factors Read More
MailBag August 07, 2009 at 01:56 PM
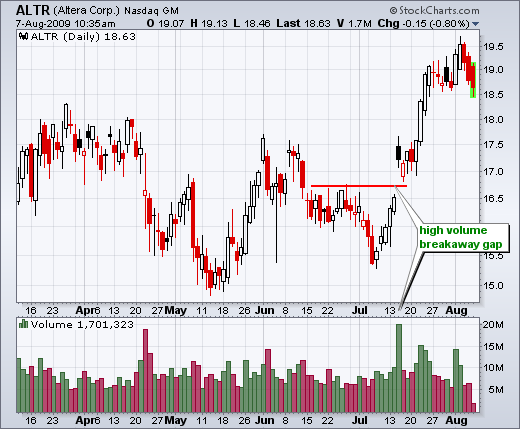
There are three types of gaps: breakaway, runaway and exhaustion. As the name implies, breakaway gaps trigger a resistance or support break. This can be part of a pattern or simply a consolidation break. Runaway or common gaps occur within an existing trend. These simply signal a continuation of the trend. Exhaustion gap are tricky because the gaps is in the direction of the trend. However, an exhaustion gap signals the last hurrah as prices quickly reverse. The first chart shows Altera (ALTR) with a breakaway gap on high volume. Notice how the stock started moving higher in early July Read More