MailBag May 27, 2011 at 09:33 AM
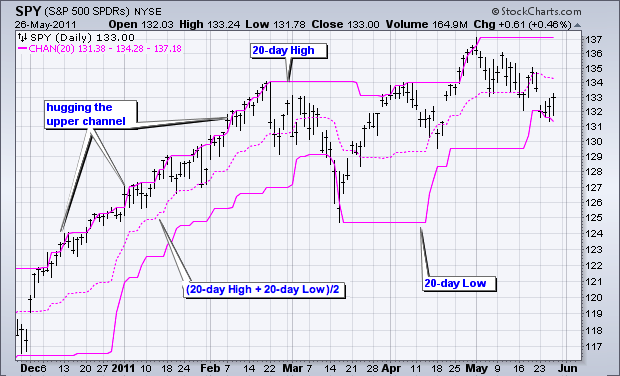
Both the Price Channel and Bollinger Bands consist of three lines, a middle line and two outer lines. These indicators produce similar lines and signals, but the lines are calculated differently. For a 20-day Price Channel, the upper line is the 20-day high and the Lower line is the 20-day low. The middle line is the average of the 20-day High and 20-day Low. The chart below shows the S&P 500 ETF (SPY) with a 20-day Price Channel. Bollinger Bands start with a 20-day SMA as the middle band. The upper band is placed two standard deviations above the moving average and the lower band is Read More
MailBag May 20, 2011 at 08:17 AM
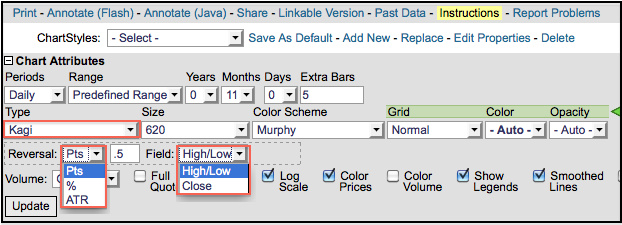
Kagi charts plot minimum price changes independent of time, which makes them similar to P&F charts. Kagi charts can be plotted by selecting “Kagi” as a chart “Type” under “Chart Attributes”. Chartists must then select a reversal amount and then a price field. Reversal amounts can be specific points, a set percentage or a fluctuating Average True Range (ATR). I would recommend points or percentage to insure uniformity. The choice between close or high-low depends on desired sensitivity. The chart below shows QQQ with a Kagi plot set at .50 and based on the high-low price field. This Read More
MailBag May 13, 2011 at 02:00 PM
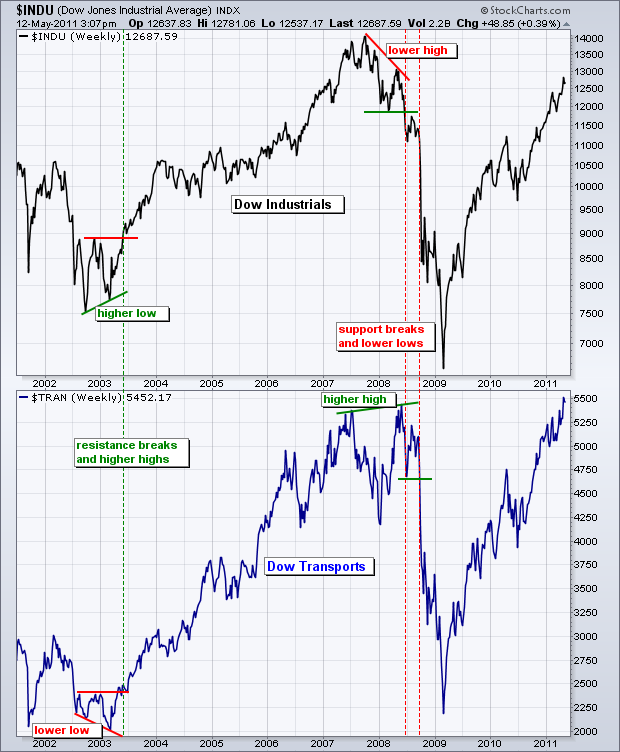
Dow Theory is based on the writings of Charles Dow, creator of the Dow Jones Industrial Average. As editor of the Wall Street Journal in the late 19th century, Dow wrote many articles detailing his thoughts on market analysis. He never wrote a book, but William Hamilton and Robert Rhea assembled and refined Dow’s work into current Dow Theory. Confirmation is at the core of Dow Theory. This means the Averages, Dow Industrials and Dow Transports, must confirm one another. Lower lows in both Averages produce a sell signal, while higher highs produce a buy signal. A non-confirmation is Read More
MailBag May 06, 2011 at 04:28 PM
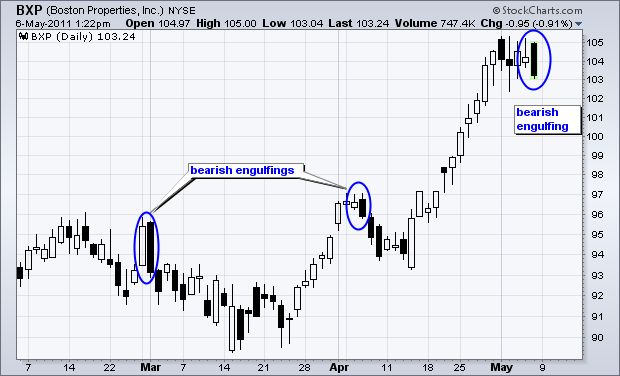
Bearish Engulfing patterns and Dark Cloud patterns are bearish candlestick reversals that form with two candlesticks. The first candlestick of a bearish engulfing is white with a large or small body. The open and close form the candlestick body. The second candlestick is black and totally engulfs the first. This means the open is above the prior close and the close is below the prior open. Prices started out strong, but reversed course and closed weak. The prior advance was totally reversed. A Dark Cloud pattern also has two candlesticks, but the first should be a long white candlestick Read More