|
|
Before looking at the interpretation, lets review what the Bullish Percent Index actually is. The BPI tells us the percentage of stocks on a P&F buy signal. BPIs are based on various indices and sectors. A stock within this index or sector is on a P&F buy signal or P&F sell signal. A basic P&F buying signal is a Double Top Breakout. A basic P&F sell signal is a Double Bottom Breakdown.
The Bullish Percent Index oscillates between zero and one hundred. There are three signals or levels to watch. First, the bulls have the edge when more than 50% of the index components are on P&F buy signals. The bears have the edge when less than 50% are on basic P&F buy signals. This implies that more than 50% are in basic P&F sell signals.

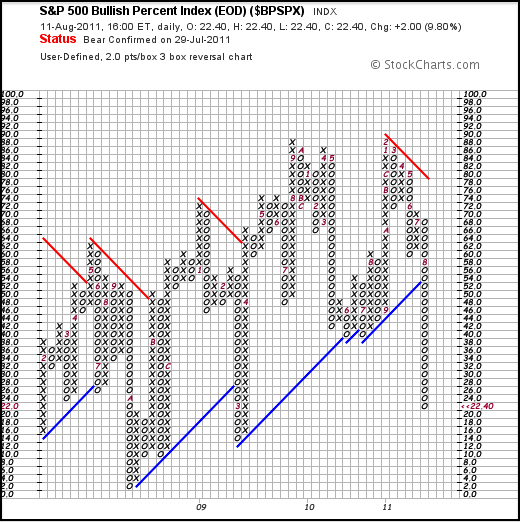
The second signal is a simple P&F chart signal. BPIs are traditionally plotted on P&F charts and chartists can use classic P&F analysis techniques for interpretation. The status of each chart is shown in the upper left corner (in red). This chart moved to “bear confirmed” on July 29th.
The third interpretation revolves around overbought and oversold levels. Traditionally, BPIs are considered overbought above 70% and oversold below 30%. After becoming overbought with a rising X-Column, a new and falling O-Column triggers a bear alert. After becoming oversold with a falling O-Column, a new and rising X-Column triggers a bull alert. The S&P 500 Bullish Percent Index ($BPSPX) is currently oversold, but still in a clear downtrend. Also notice that the BPI is approaching its March 2009 lows. Rising X-Column could trigger a bull alert. You can read more on the Bullish Percent Index in our ChartSchool. A list of Bullish Percent Indices can be found at the bottom of the market summary page.


