|
|
%B reflects the location of the closing price relative to the Bollinger Bands. A %B reading below zero means price closed below the lower Band. A %B above 1 means price closed above the upper band. In this manner, %B can be used in scans to identify securities that have recently broken a Bollinger Band. %B readings between .80 and 1 suggest that prices are near the upper band, while %B readings between .20 and 0 indicate that prices are near the lower band.
Click this image for a live chart.
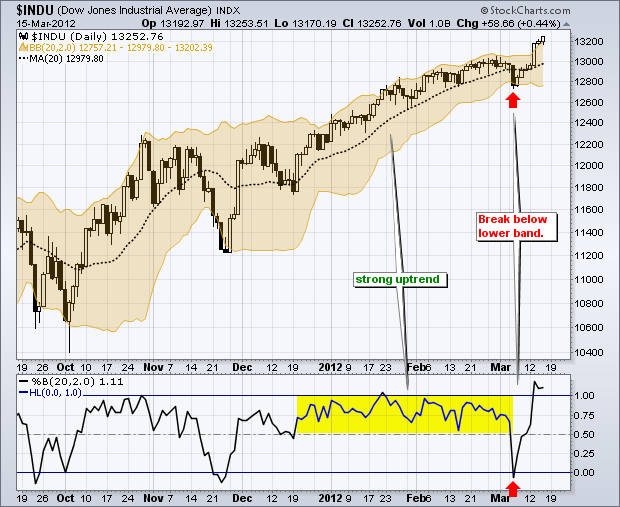
The chart above shows the Dow Industrials with narrowing Bollinger Bands in early March. After a brief close below the lower band, the Dow immediately recovered and moved above its upper band this week. Notice that %B dipped below 0 last week, crossed above .50 last Friday and exceeded 1 with Wednesday’s surge.
Bollinger Bands are set two standard deviations above and below the 20-day SMA. This means the 20-day SMA is the centerline or middle band. As far as %B is concerned, a move above .50 (centerline) signals a break above the 20-day SMA, while a move below .50 signals a break below the 20-day SMA. %B typically remains above .50 during strong uptrends, as it did from 20-Dec to 5-Mar on the Dow chart. You can read more on %B in our ChartSchool.


