MailBag April 27, 2012 at 11:00 AM
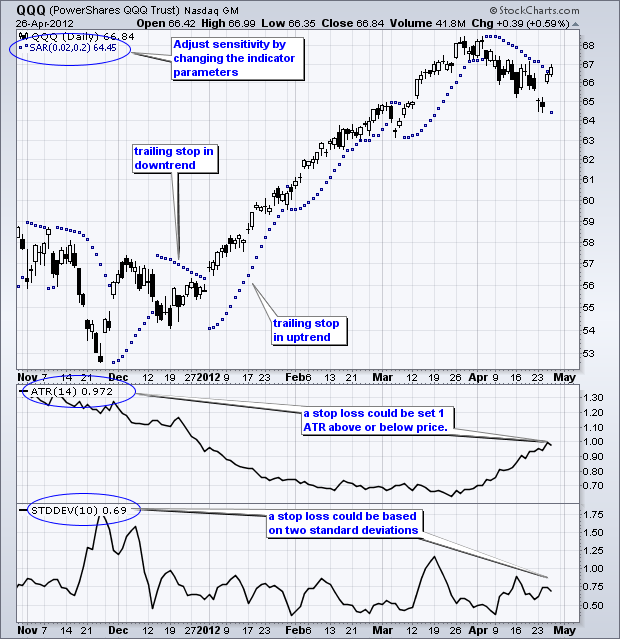
SharpCharts has several indicators that can be use to set stops. Wells Wilder, creator of RSI and the Average Directional Index (ADX), developed two indicators that can be used to set stops: the Parabolic SAR and Average True Range (ATR). Parabolic SAR is a stop-and-reverse system that adjusts as prices change direction. It is below prices in an uptrend and above prices in a downtrend. More importantly, it trails prices as the trend unfolds. This means it can be used to consistently raise stops as an uptrend extends and lower stops as a downtrend extends. Click here for a live chart.The Read More
MailBag April 20, 2012 at 08:51 AM
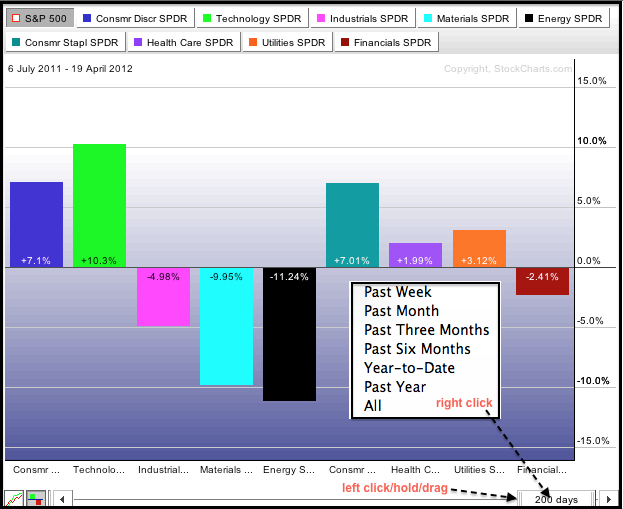
Chartists can use PerfCharts to rank relative strength for the nine sector SPDRs over various timeframes. The percentage change shown on this PerfChart is the amount of over or under performance relative to the S&P 500. This is not the absolute performance. 200-days is default setting, but users can quickly change this with the slider at the bottom. Right click on the slide to see the different timeframes or left click/hold on the edge and drag the slider to manually adjust the timeframe. Also note that the entire slider can be moved by clicking/holding in the middle and dragging Read More
MailBag April 13, 2012 at 06:08 PM
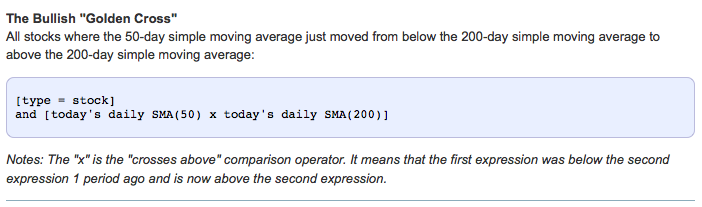
StockCharts.com users can find dozens of great scans from the Advanced Scan Library. This is a collection of scans divided into four groups: samples scans, predefined scans, published scans and user-contributed scans. Chartists can use these scans as they are or learn from the code to create their own unique scans. Sample Scans provide relatively easy examples to learn how to write scans. Users can learn how to define a bullish golden cross, overbought readings in RSI or limit the results to one sector. Predefined Scans cover dozens of basic technical expressions, such as Read More
MailBag April 06, 2012 at 11:17 AM

A throwback is a counter trend move that occurs after a resistance or support break. A bullish throwback evolves after a resistance break as a pullback to broken resistance, which turns into support. A bearish throwback forms after a support break as an oversold bounce back to broken support, which turns into resistance. Click here for a live chart The first example shows Autodesk (ADSK) with a bullish throwback after a resistance break. Notice how the stock broke resistance with a high volume surge. Broken resistance around 35 then turned into support and the stock declined below Read More