|
|
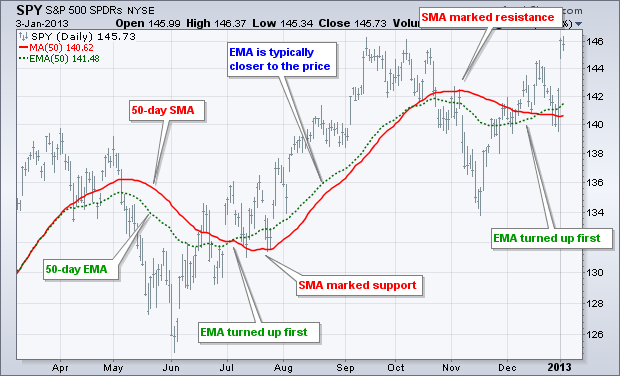
There are two types of moving averages offered on the SharpCharts workbench: simple moving averages and exponential moving averages. As with all averages, both show an average price over a specified look-back period. The 50-day simple moving average (SMA) is the average price over the last 50 days. The exponential moving average (EMA) takes this average one step further by applying more weight to current prices. This reduces the lag and increases the price sensitivity.

Click this image for a live chart.
The chart above shows the S&P 500 ETF (SPY) with the 50-day SMA in red and the 50-day EMA in green (dashed). Notice how the EMA turned up ahead of the SMA in July and again in December. In fact, the 50-day SMA is still moving lower and has yet to turn up. These two moving averages often have different uses. Simple moving averages are often used to mark support and resistance levels. Exponential moving averages, because of their price sensitivity, are often used to define price direction. You can read more about moving averages in our ChartSchool.


