|
|
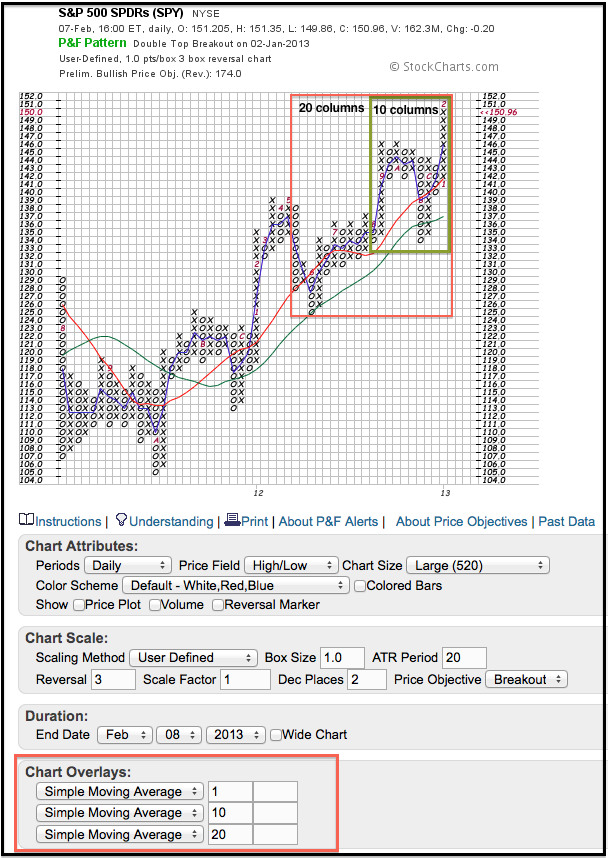
Chartists can overlay four indicators on Point & Figure charts at StockCharts.com. These overlays, which include trend lines, moving averages, Bollinger Bands and Price-by-volume, can be added by using the dropdown menu under the P&F chart. P&F moving averages are based on the average price of each column. A 1-period SMA offers an easy and straightforward example. An X-Column extending from 141 to 151 would have a 1-period SMA equal to 146 [(141 + 151)/2 = 146]. The blue line in the chart below shows the 1-period SMA for SPY.

Click this image for a live chart.
The red line shows a 10-period SMA and the green line shows a 20-period SMA. A 10-period SMA is the average price of the last 10 columns, which is marked by the green box. A 20-period SMA is the average price for the last 20 columns, which is marked by the red box. See our ChartSchool article for detailed information on these indicators.


