MailBag May 31, 2013 at 09:41 AM
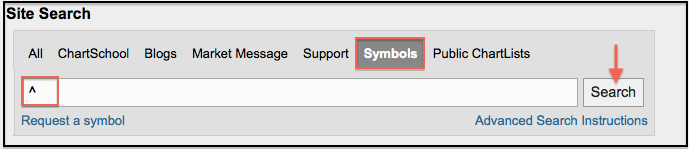
StockCharts.com users can chart an array of futures contracts from the CME Group and the IntercontinentalExchange (ICE). All of these symbols begin with a caret (^). Users can go to the symbol catalog and search for this character to see all the symbols. This gives chartists the opportunity to chart the E-mini S&P 500, gold futures, copper futures and coffee futures. The chart below shows Natural Gas Futures for June 2013. Read More
MailBag May 24, 2013 at 08:49 AM
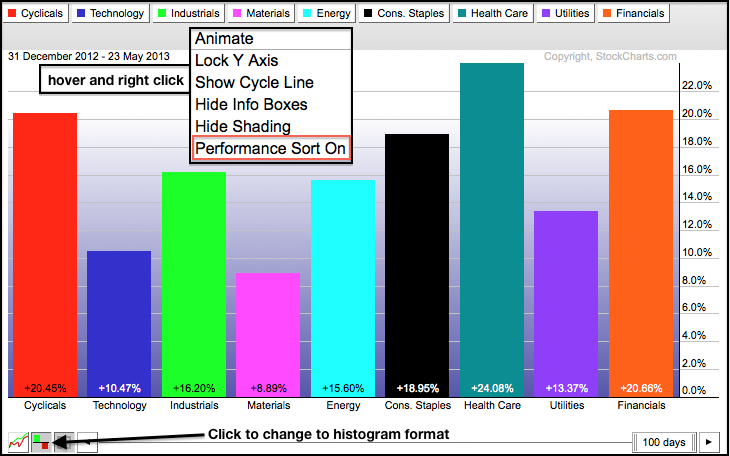
Chartists can sort a PerfChart by performance by first choosing histogram view in the lower left corner. Once the histogram bars show, hover over the chart area, click the right mouse button and choose “performance sort on” from the options. This will place the strongest security on the left and sort by performance. This makes it easy to separate the winners from the losers. You can remove this option by clicking the right mouse button and choosing “performance sort off”. Click these images for a live chart Read More
MailBag May 17, 2013 at 12:55 PM
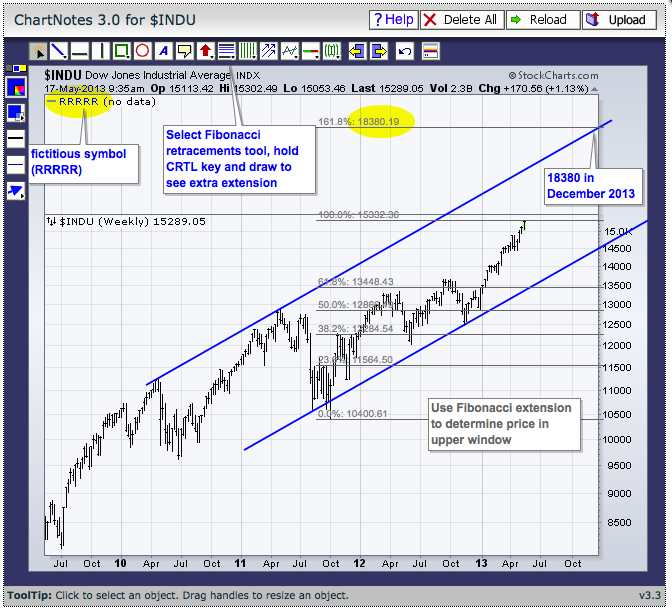
Chartists can add empty space above the main chart window by adding a fictitious “price” indicator. Chartists can also add space to the right using the “extra bars” feature. By adding space to the right and above, chartists can extend channel trendlines, add Fibonacci extensions and extend cycles to make projections. The chart below shows the Dow Industrials with added space. Notice how I used the Fibonacci Retracements Tool to add an upper extension to determine the price at a point on the channel trend line. To do this, first select the Fibonacci Retracements Tool when annotating the Read More
MailBag May 10, 2013 at 09:37 AM
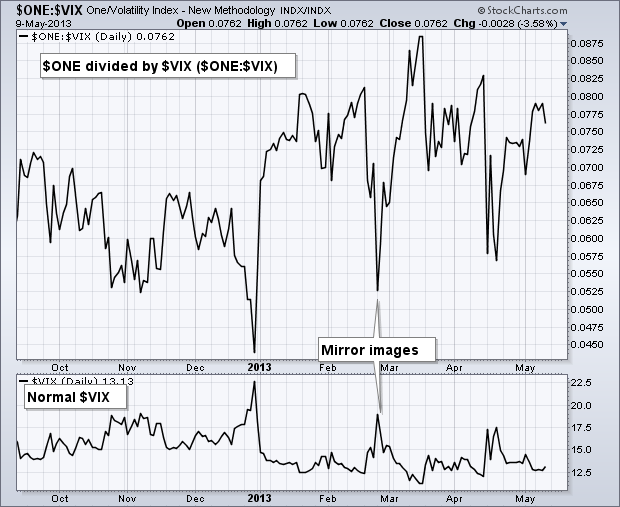
StockCharts.com users can invert a price series by using the symbol “$ONE”. Simply create a ratio chart using $ONE as the numerator and the other symbol as the denominator. The chart below shows $ONE:$VIX in the main window and the normal $VIX in the lower window. Inverted $VIX can be handy because the normal $VIX is inversely correlated with the stock market. In other words, $VIX moves up when the stock market moves down. This relation changes to a positive correlation when using inverted $VIX ($ONE:$VIX). Read More
MailBag May 08, 2013 at 12:15 PM
Recently (on May 6th actually), we received the following message in our support queue: The above chart (PCG) should be found by the following scan, but is not. Can you tell me what is wrong with the last line of code? Each of the lines are true but the last line is not working. I tested it by adding a line at a time. Syntax is correct, but it is not finding all valid charts. Is this a problem with the scan engine? [type = stock] and [country = us] and [optionable is true] and [close >= 10] and [close <= 200] and [today's sma(50,volume) >= 500000] and [Slow Read More
MailBag May 03, 2013 at 10:05 AM
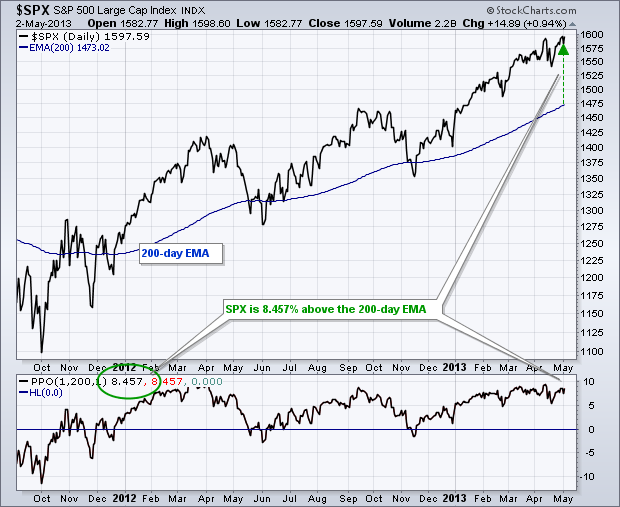
Chartists can use the Percent Price Oscillator (PPO) to measure the percentage difference between price and an exponential moving average. The PPO is measures the percentage difference between two exponential moving averages. We can set the shorter EMA equal to one and this will reflect the closing price. We can then set the longer EMA to measure the distance from price (shorter EMA). The example below shows the PPO(1,200,1), which measures the percentage difference between the S&P 500 (1-period EMA) and its 200-day EMA. I set the signal line at one to hide it on this chart. The Read More