|
|
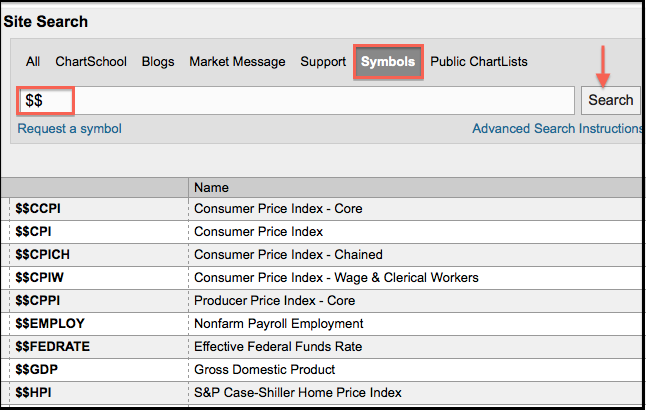
Chartists can plot over 20 different economic indicators at StockCharts. These can be found by searching for “$$” in the symbol catalog (without quotation marks). The image below shows a sample search and results.

Click this image for a live search
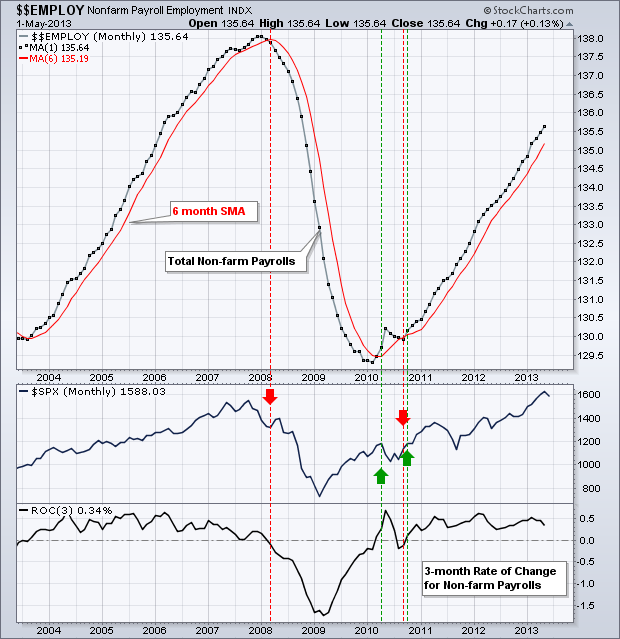
Chartists can plot these economic indicators using our SharpCharts tool. This makes is possible to add indicators for analysis and other symbols for comparative purposes. The example below shows Non-farm Payrolls ($$EMPLOY), its three-month rate of change and the S&P 500 for comparison.

Click this image for a live chart

Click this image for a live search
Chartists can plot these economic indicators using our SharpCharts tool. This makes is possible to add indicators for analysis and other symbols for comparative purposes. The example below shows Non-farm Payrolls ($$EMPLOY), its three-month rate of change and the S&P 500 for comparison.

Click this image for a live chart


