|
|
In publishing an article last week with PPO, we received an email back asking why we started using PPO and what is it?
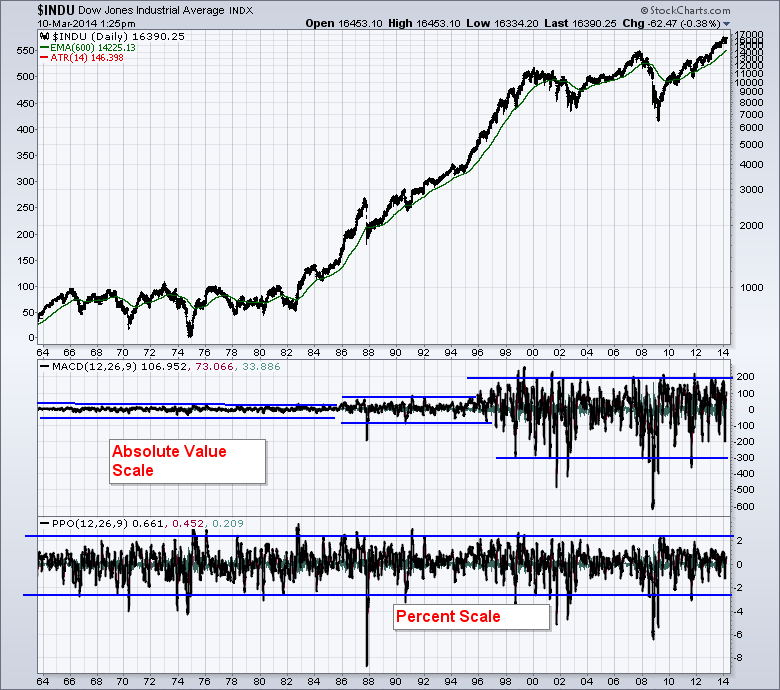
Here is a chart of both the PPO and the MACD applied to the $INDU chart.
First of all, let's work through what the PPO is and why it is has benefits.
PPO - stands for Percentage Price Oscillator. So rather than measuring the absolute price difference, it measures the percentage price difference. The reason this is important is for stocks or indexes with big differences in price.
The MACD indicator works off price. It measures the difference between two values. As time goes by, the $INDU chart has gone from 1000 to 16000. The MACD would make the moves in the early days seem insignificant relative to the moves today.
This is the same chart below, so you don't have to flip, flip, flip on your iPad.
On a plot of the $INDU with the PPO and the MACD we can see different information. We are using the same settings in both indicators. You can see on the left that the MACD looks flat, where the MACD on the right seems to have the biggest oscillations. That is because the $INDU can move a 1000 points in 10 days now. In the old days it would move a few points a day and 1000 points was the upside ceiling for the entire $INDU for almost 10 years. The percentage change has been the same historically, other than extremes, but the actual numerical value of the move is substantially more each day. The $INDU currently has an Average True Range of 146 points/day.
If you click on the chart, change the opacity settings on the ATR line under 'indicators' from 0 to 1. Then you will see how the size of the move each day has changed over the years. So the MACD always makes the right side more important if the price in the underlying stock gets higher. Using the PPO for long time span charts may help the quality of the information.
Also, for more information, check the ChartSchool tab. On the right hand side is a search box just for ChartSchool. Enter the indicator like EMV, PPO, ATR and then you are able to see more information about the indicator and how it is used. These are well written articles, most of them by Arthur Hill.
Good trading,
Greg Schnell, CMT.


