|
StockCharts users can chart the correlation between two asset classes using the Correlation Coefficient indicator. This tells us the degree of correlation between two symbols. A positive Correlation means the two move in the same direction, while a negative Correlation Coefficient means they move in opposite directions. The video is at the bottom of the article.
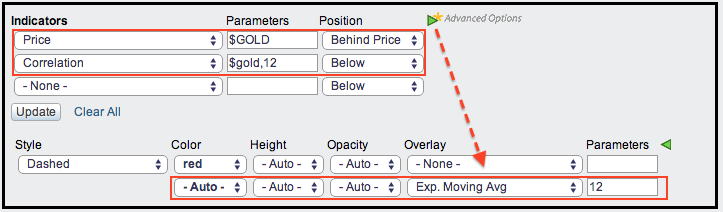
The Correlation Coefficient can be added as an indicator and placed above or below the main chart window. Note that chartists can use the "Advanced Options" to add an indicator to the Correlation Coefficient, such as a moving average. In the example above, 12-month exponential moving average was added to smooth out the fluctuations in the indicator.
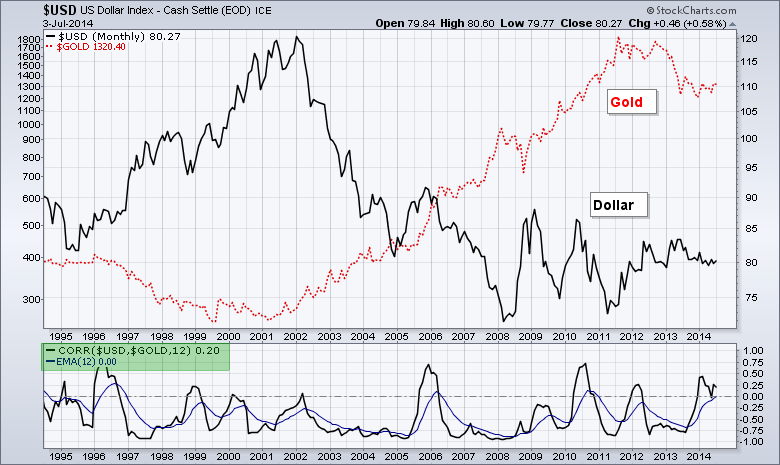
Chartists can also place both symbol plots in the main chart window to directly compare price movements. The example below shows Spot Gold ($GOLD) and the Dollar Index ($USD) in the main window with the Correlation Coefficient ($USD,$GOLD) in the indicator window. A second symbol can be added to the main window by choosing "Price" as the indicator, entering the symbol and placing it "Behind Price".