
|
A bearish signal reversed is a bullish P&F signal that suddenly occurs after a series of lower lows and lower highs. First, a P&F downtrend needs to be present on the chart. Note that X-Columns represent rising prices and O-Columns represent falling prices. A downtrend is present when successive X-Columns fail to exceed the high of the prior X-Column and O-Columns form lower lows. The bearish signal reversed signal occurs when the current X-Column surges above the prior X-Column to reverse this downtrend.
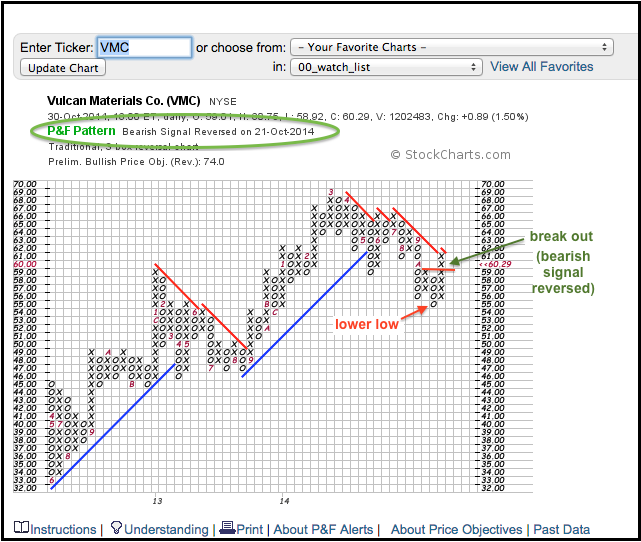
The chart above shows Vulcan Materials (VMC) with a series of lower lows and lower highs since August, which is marked with the red number 8. Actually, the downtrend has been present since April (red 4) because the X-Columns have not formed a higher high since March (red 3). After making another lower low at 55, the bearish signal reversed with a surge above the prior X-Column. Before leaving this chart, notice that the current X-Column is challenging the bearish resistance line.

Posted by: Sande Blumenthal November 01, 2014 at 16:31 PM