|
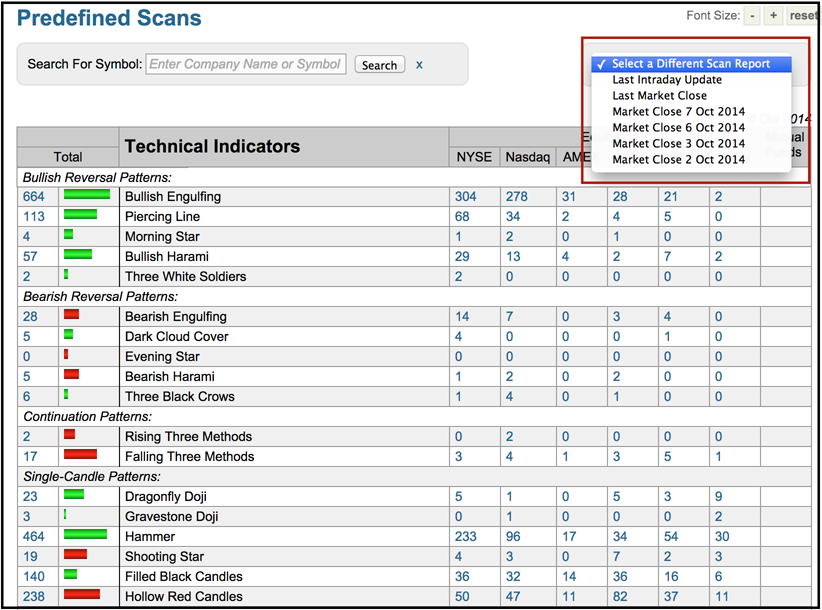
The stock market pulled off a big intraday reversal on Wednesday and many stocks formed bullish engulfing patterns. There were 304 on the NYSE and 278 on the Nasdaq. Chartists can find these stocks using the Predefined Scans Page, but Wednesdays' results are not immediately visible because the default page will show the most recent scan results.
StockCharts users can access prior results with the click of the mouse. Simply go to the dropdown menu in the upper right, which is entitled "Select a Different Scan Report". Users can view the last intraday update, the last close or pick a prior date. The bullish engulfing patterns formed on October 8th.
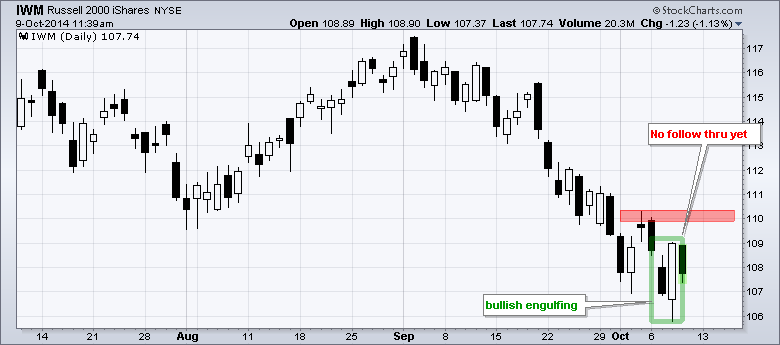
Why would chartists be interested in old scan results? Believe it or not, it can sometimes help to let these patterns cool down for a couple of days. Keep in mind that follow-through is required for most candlestick patterns. These bullish engulfing patterns formed on Wednesday and the stock market stalled on Thursday. Chartists can keep an eye on these patterns for follow through in the coming days. Failure to follow through within five days would undermine these patterns.