
|
Shading the area between Bollinger Bands provides a different look and some people may prefer that to the default lines. This tutorial shows how you can create shaded bands.
Expand the "Advanced Options" for Overlays in the SharpCharts Workbench
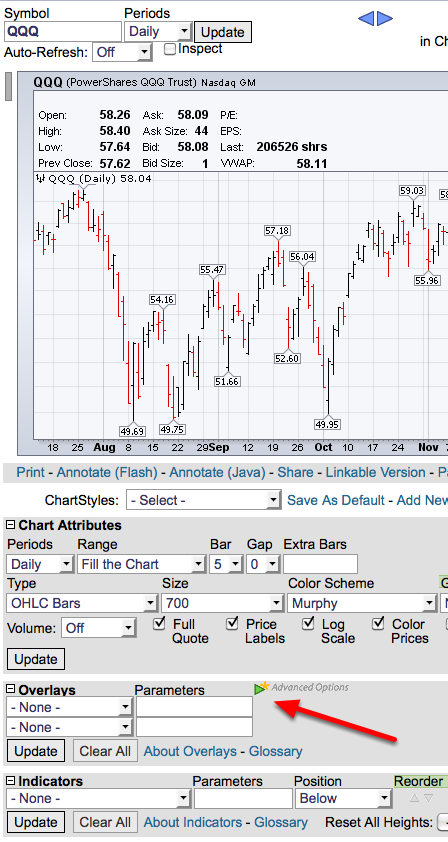
Click on the green arrow on the right side of the "Overlays" section to expand. Skip to the next step if this is already done.
Add Bollinger Bands to the Chart and Select Your Options

1.Click on the dropdown to select "Bollinger Bands" and enter the parameters you want to use (20,2 is the default).
2.Click on the "Style" dropdown and select "Area".
3.Select a color if you want one other than "Auto" in this case we are using Gold.
4.Click "Update."
Optional - Add Mutliple Bands

You can also use multiple shaded Bollinger Bands on a chart to find what parameters best fit your style of trading as outlined in this Blog article written by Chip Anderson. To add multiple bands, repeat the steps 1-4 from above.