
|
Have you needed to view a past indicator or overlay value but don't know how? Below are the options on how to view a previous day's indicator or overlay value.
Change the Date Range
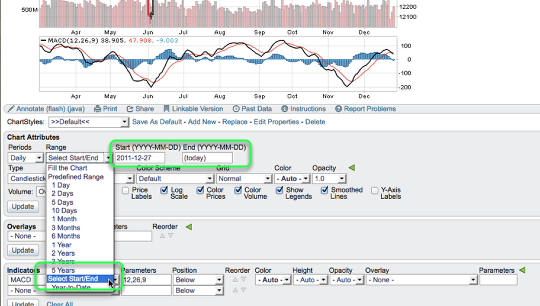
One way to view the indicator or overlay value for a date in the past is to use the "select start/end" date range and put the end date for the day you want to view the indicator/overlay value for. To select this option go to the "chart attributes" section, click the "range" drop-down, select the option "select start/end" and enter in your date range.
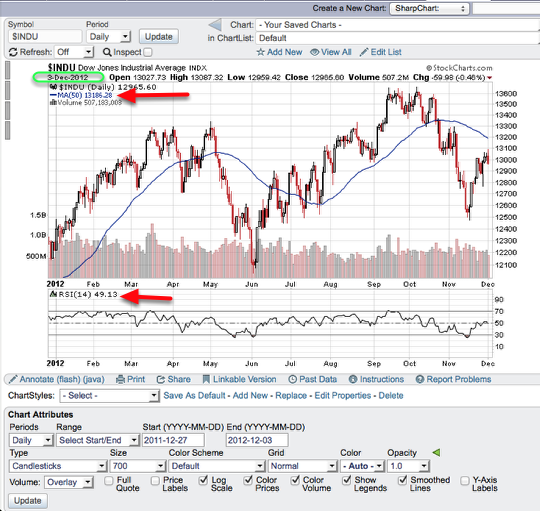
In this example we will view the RSI and Simple Moving Average value from 12/3/2012. If you look on the chart you will see the end date has been set to 12/3/2012. The chart in the top right shows Dec 3, 2012 as the date for the chart. The moving average and RSI values displayed are that from 12/3/12.
Use Inspect
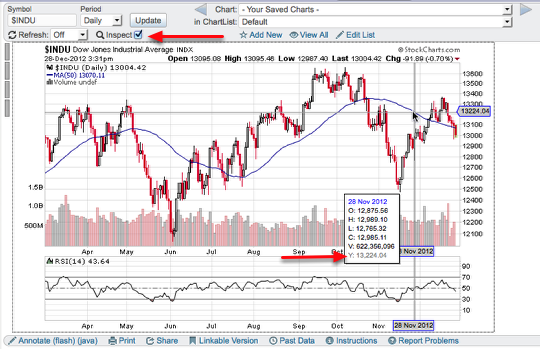
The second option to view an indicator or overlay value if you don't want to change the date range is to use the inspector. To turn on inspect check off the box located in the upper left corner above the chart. Once inspect is selected mouse over the chart and in the pop-up box that displays on the chart the y-value is your indicator or overlay value.
To learn more about the inspect tool please refer to this blog article.
If you have any questions about a previous indicator or overlay value contact our support team by sending a support request.