Art's Charts July 30, 2010 at 05:25 AM
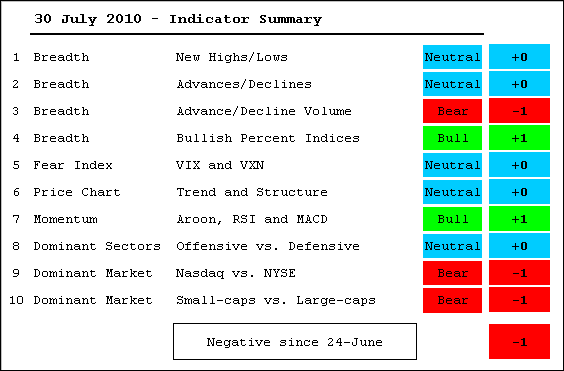
It all depends on where we set key resistance. If the mid July highs marked key resistance, then this indicator summary would be in bull mode. If the mid June highs mark key resistance, then a number of indicators and ETFs remain short of trend changing breakouts... Read More
Art's Charts July 30, 2010 at 04:31 AM
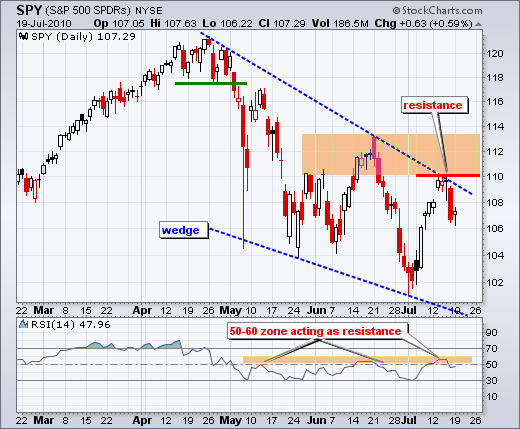
Even though the July surge had impressive breadth and upside momentum, the S&P 500 ETF (SPY) is clearly running into resistance around 112. Resistance from prior highs and key retracements is not surprising... Read More
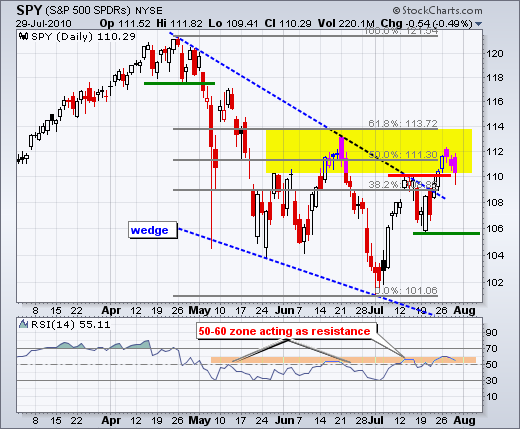
Art's Charts July 29, 2010 at 05:00 AM
There is no change on the daily chart as SPY stalls in its resistance zone. Even though the strong July surge and wedge breakout are medium-term bullish, SPY is still on the overbought side and battling resistance... Read More
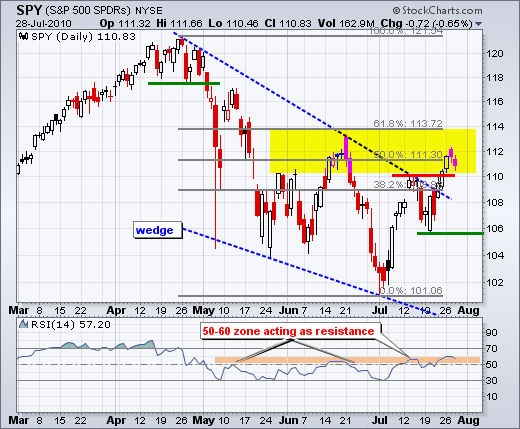
Art's Charts July 28, 2010 at 04:33 AM
After strong buying pressure four of the last five days, stocks took a breather on Tuesday as the S&P 500 ETF (SPY) forged a small red candlestick. SPY opened above 112 and closed below 112. After a strong open, SPY moved lower and this indicates selling pressure... Read More
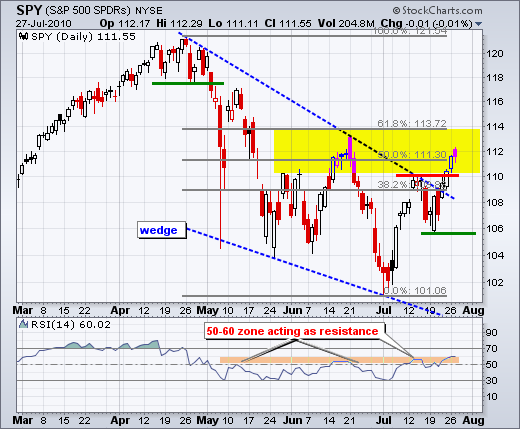
Art's Charts July 27, 2010 at 05:54 AM
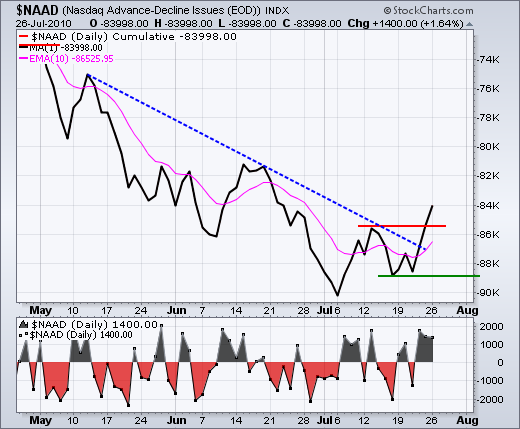
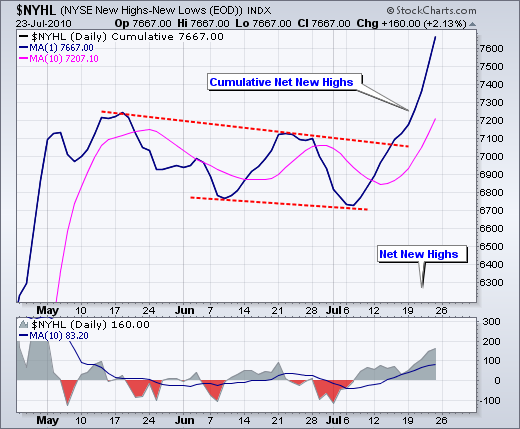
Even though volume has been light in July, breadth has been strong, especially on the NYSE. Breadth is picking up steam on the Nasdaq as Net New Highs hit +91 and Net Advances exceeded +1000 for the third day in a row... Read More
Art's Charts July 26, 2010 at 05:20 AM
The medium-term picture is perking up as stocks finished strong last week. SPY started the week with an indecisive candlestick last Monday. After a weak open below 106 on Tuesday, SPY finished strong with a close above 108 that very same day... Read More
Art's Charts July 20, 2010 at 03:45 AM
On the daily chart, the S&P 500 ETF (SPY) stalled with a small gain on the day. After Friday's sharp decline, a little indecision or a small rebound is normal. There is really no change on the daily chart... Read More
Art's Charts July 19, 2010 at 03:52 AM
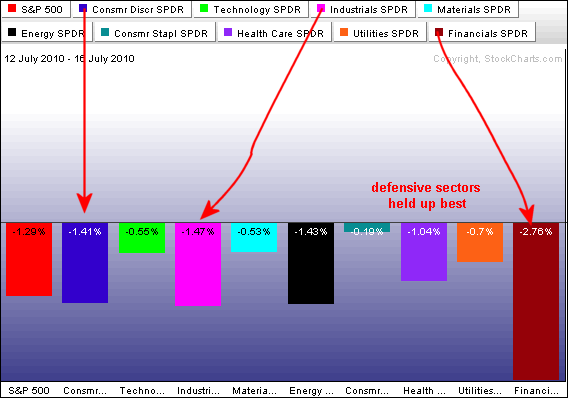
Stocks moved sharply lower with a broad decline on Friday. The major indices were down from 2.52% (Dow) to 3.82% (Russell 2000). Small-caps continue showing relative weakness. All sectors were down with finance (-4.21%), consumer discretionary (-3.50%) and industrials (-3... Read More
Art's Charts July 16, 2010 at 05:08 AM
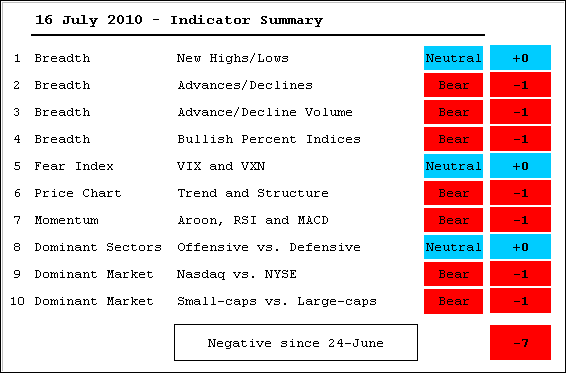
Even though last week's bounce continued this week, the indicator summary remains negative. The AD Lines and AD Volume Lines surged, but remain below their June highs (resistance). Another strong week would likely push these indicators above resistance and into bull mode... Read More
Art's Charts July 16, 2010 at 03:52 AM
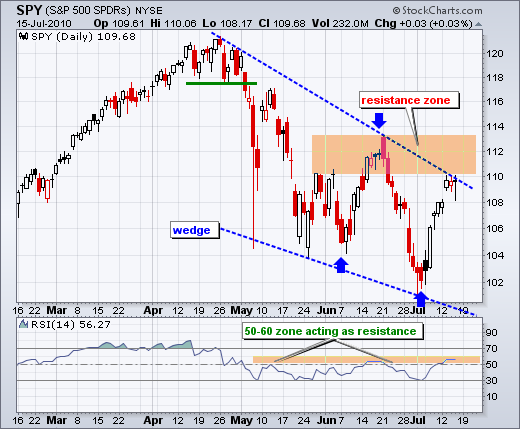
There is no change on the daily chart as SPY stalls just below its big resistance zone. On a closing basis, there have been three moves in excess of 6% over the last 26 days (blue arrows). First, SPY bottomed on June 7th and advanced 6.4% in nine days... Read More
Art's Charts July 15, 2010 at 04:10 AM
There is no change on the daily chart as SPY stalls just below its big resistance zone. On a closing basis, there have been three moves in excess of 6% over the last 26 days (blue arrows). First, SPY bottomed on June 7th and advanced 6.4% in nine days... Read More
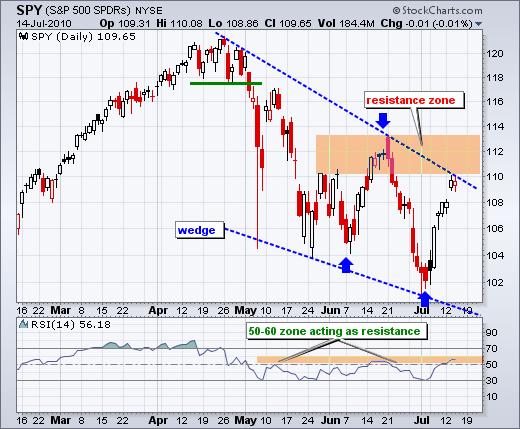
Art's Charts July 14, 2010 at 03:24 AM
Stocks were oversold 7-8 days ago and an oversold bounce was expected. However, I must admit that I did not expect a move all the way to the 110-113 resistance zone, especially after sharpness of the prior decline... Read More
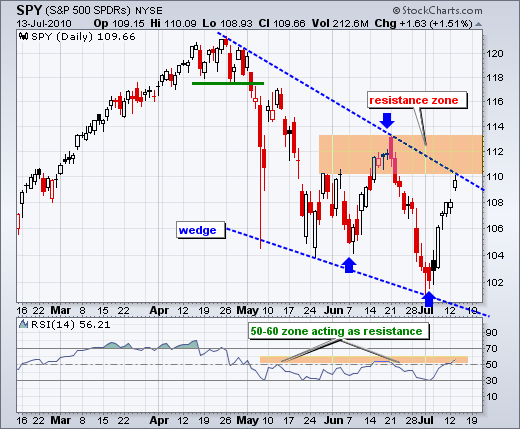
Art's Charts July 13, 2010 at 03:43 AM
See the Market Message for today's commentary ( click here)... Read More
Art's Charts July 12, 2010 at 04:01 AM
There is no change on the daily chart. SPY remains in a downtrend overall and is currently trading near the middle of its seven week range (113-101). A falling wedge defines the overall downtrend with a resistance zone around 110-113 from the June highs... Read More
Art's Charts July 09, 2010 at 05:13 AM
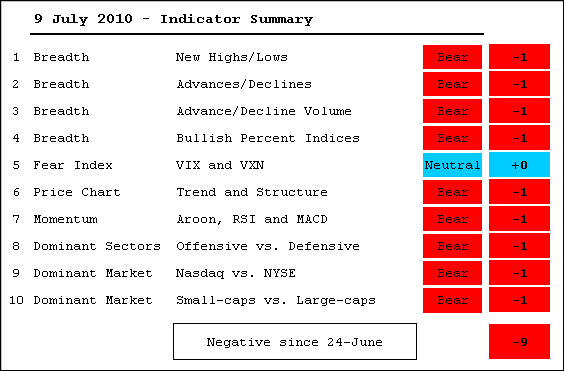
Even with this week's bounce, the indicator summary remains decidedly negative. The AD Lines and AD Volume Lines remain in clear downtrends and bullish divergences have yet to appear. NYSE Net New Highs have yet to break down, but have yet to surge higher... Read More
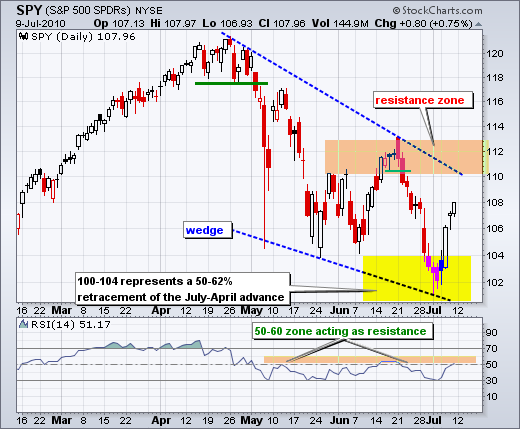
Art's Charts July 09, 2010 at 04:42 AM
On the daily chart, SPY remains in a downtrend overall and is currently trading in the middle of its seven week range. This range includes the mid June high around 113 and the early July low around 101... Read More
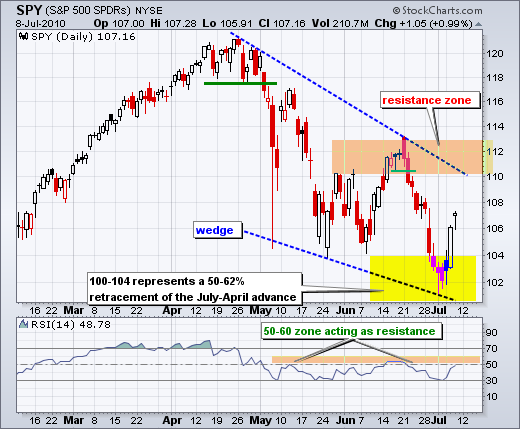
Art's Charts July 08, 2010 at 03:37 AM
Stocks surged yesterday with a pretty strong advance. Advances swamped declines and advancing volume far exceeded declining volume - on both the NYSE and the Nasdaq. Volume was light, but volume should be light during the summer so I am not concerned with volume at this point... Read More
Art's Charts July 07, 2010 at 03:11 AM
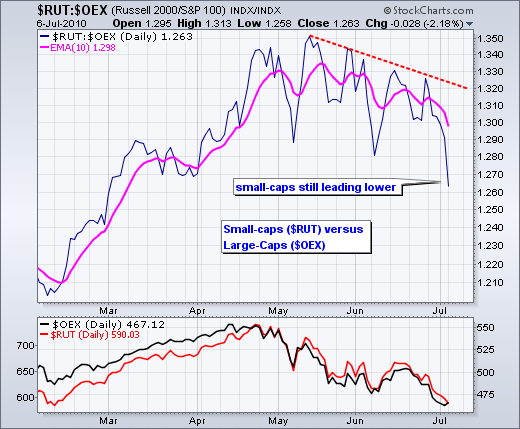
Stocks were strangely mixed on Tuesday with the large-cap indices edging higher and the small-cap indices falling rather sharply. The S&P 500 and Dow gained around .50%, but the Russell 2000 and S&P 600 SmallCap Index lost around 1.50%... Read More
Art's Charts July 06, 2010 at 03:56 AM
After a steep decline the last two weeks, stocks are deeply oversold and pessimism is running rampant. A story on Bob Prechter's "take cover" forecast is the "most emailed" article in the New York Times... Read More
Art's Charts July 02, 2010 at 04:15 AM
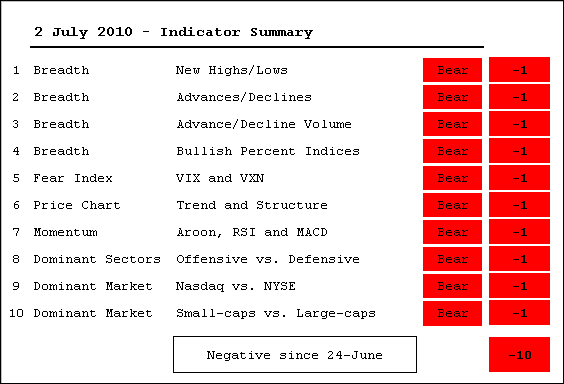
With a sharp decline the last two weeks, all indicators are in bear mode. The indicator summary turned negative last Friday (-4) and moved to -10 this week. Oversold conditions and excessive bearish sentiment are the only positives in the stock market right now... Read More
Art's Charts July 02, 2010 at 03:43 AM
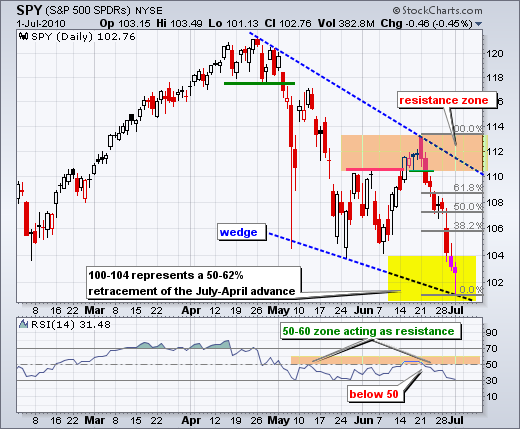
After a 9 day 9.7% decline from high to low, the S&P 500 ETF (SPY) formed a hammer by closing well above its intraday low. I do not think this was the big selling climax, but it does mark an intraday reversal that could put in a short-term low... Read More
Art's Charts July 01, 2010 at 03:44 AM
Stocks attempted to hold their ground on Wednesday, but afternoon selling pressure drove the major index ETFs below Tuesday's lows. The major index ETFs were down around 1%. All sectors were lower with technology, consumer discretionary and finance leading the way down... Read More