Art's Charts November 30, 2012 at 07:44 AM
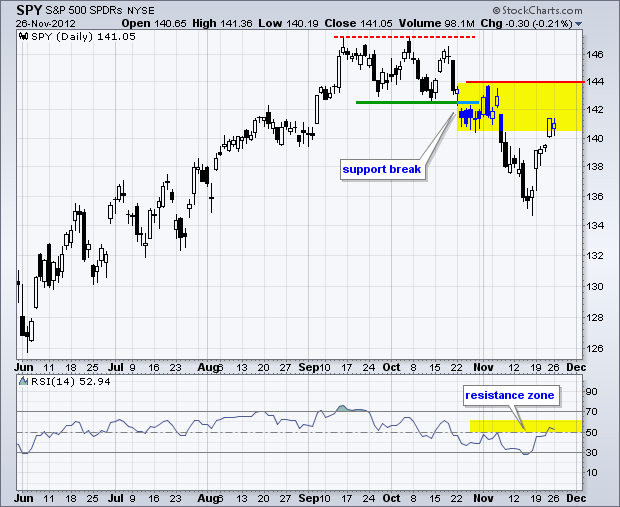
Art's Charts November 30, 2012 at 06:44 AM
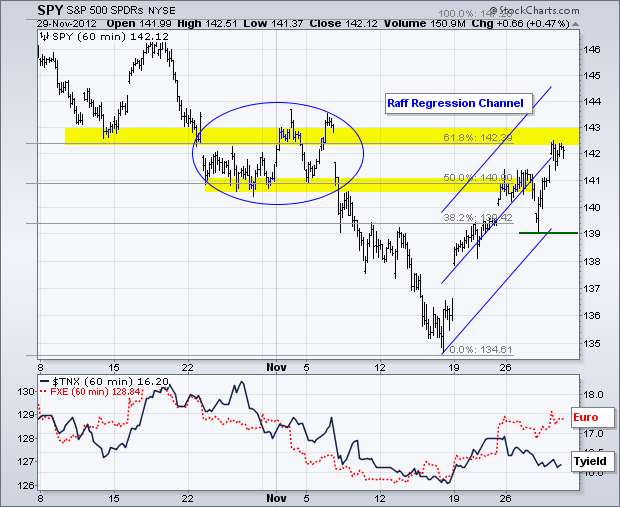
On the 60-minute chart, SPY edged higher on Thursday and moved to the top of its resistance zone. Broken support, the early November highs and the 61.80% retracement mark resistance in the 143 area... Read More
Art's Charts November 29, 2012 at 05:40 AM
Stocks started the day weak as the major index ETFs gapped down on the open. This gap did not last long as stocks rallied the rest of the day and closed higher. The actual gains were not huge, but the ability to rally after a gap down shows resilience... Read More
Art's Charts November 29, 2012 at 05:36 AM
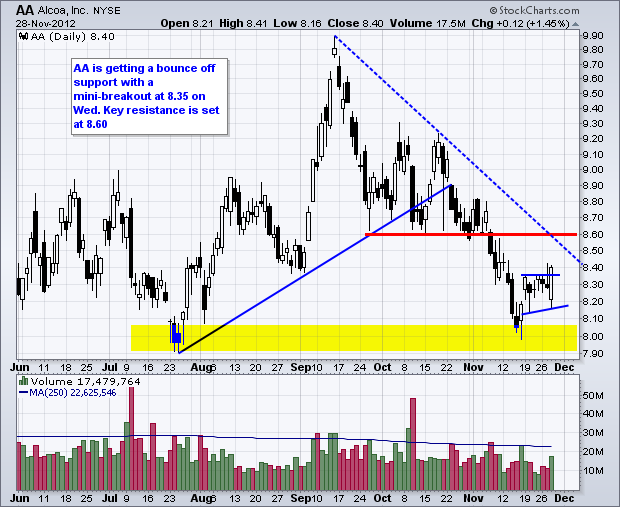
AA Bounces off Support with mini-breakout. ORCL Advances Nine Days Straight. Plus ALTR, BOOM, KLAC, LLTC, ORCL, TJX This commentary and charts-of-interest are designed to stimulate thinking... Read More
Art's Charts November 28, 2012 at 04:26 AM
Stocks edged lower on Tuesday as the major index ETFs worked off short-term overbought conditions. Eight of the nine sectors were lower with the Finance SPDR (XLF) and Energy SPDR (XLE) leading the decline. Both lost around .90% on the day... Read More
Art's Charts November 27, 2012 at 07:09 AM
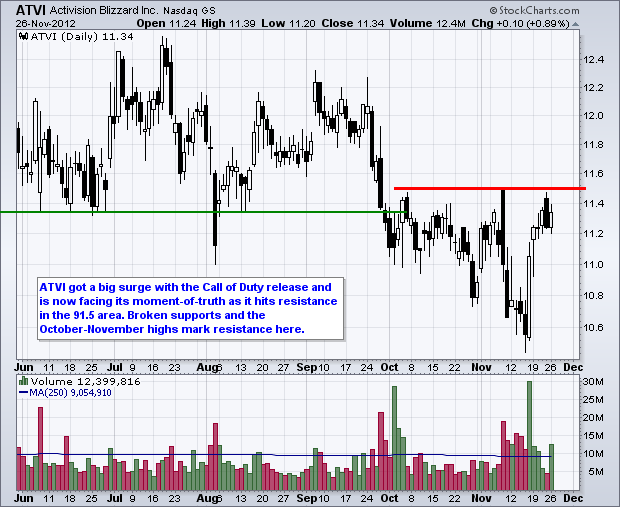
ATVI Hits Momentum of Truth after Big Game Release. AKAM Fails to Partake in Market Surge. Plus ARUN, CHS, GOOG, KSS, MMM This commentary and charts-of-interest are designed to stimulate thinking... Read More
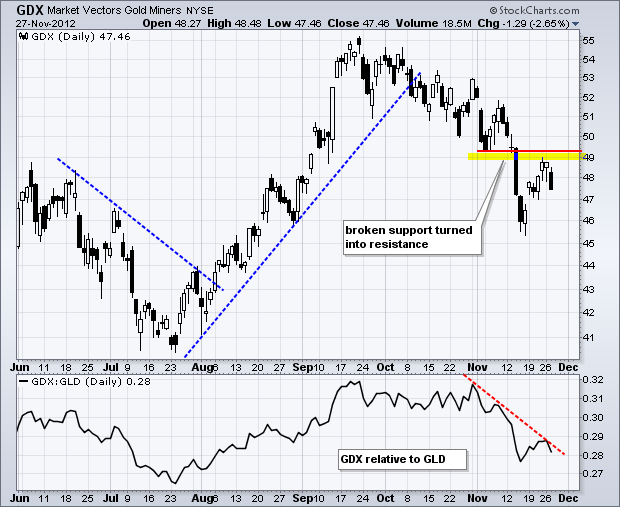
Art's Charts November 27, 2012 at 06:45 AM
The markets started November in risk-off mode as stocks and the Euro moved sharply lower. Both became quite oversold mid month and the major index ETFs formed hammers on Friday, November 16th... Read More
Art's Charts November 19, 2012 at 12:15 PM
Programming note: I will be taking some time off for Thanksgiving and the next commentary will appear on November 27th. Stocks managed to firm on Friday with a number of ETFs forming hammer-like candlesticks. Hammers form with small bodies near the top of the high-low range... Read More
Art's Charts November 16, 2012 at 06:12 AM
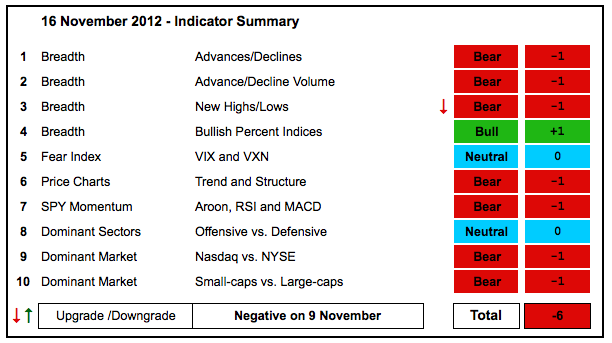
The bulk of the evidence remains decidedly bearish. Even though stocks are oversold, the decline accelerated the last two weeks and we have yet to see any kind of selling climax or washout that would indicate a near-term bottom... Read More
Art's Charts November 16, 2012 at 04:23 AM
Even though Thursday's losses were small, stocks just can't seem to shake that selling feeling. The major index ETFs edged lower the small-caps again leading the way. The sectors were mixed with three up and six down. Gains and losses were also small though... Read More
Art's Charts November 15, 2012 at 05:13 AM
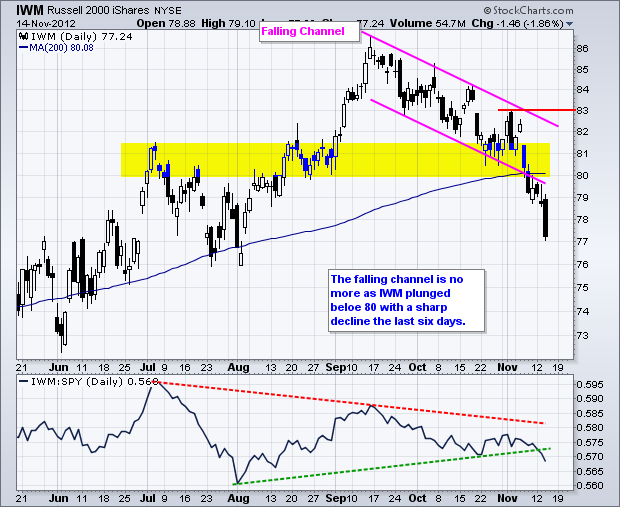
Selling pressure continued on Wednesday as the major index ETFs fell over 1%. The S&P MidCap 400 SPDR (MDY) and Russell 2000 ETF (IWM) led the way with losses approaching 2%. All sectors were down with the Finance SPDR (XLF) and the Industrials SPDR (XLI) leading the way... Read More
Art's Charts November 15, 2012 at 05:08 AM
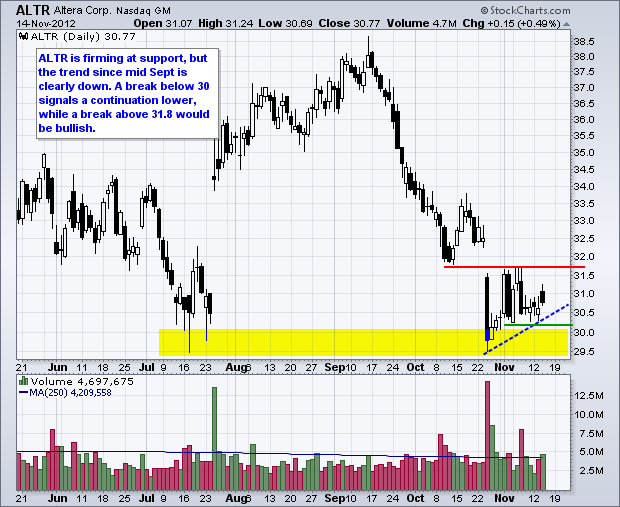
ALTR Firms At Support. ARO Bucks the Selling Pressure. Plus CAKE, CHKP, COST This commentary and charts-of-interest are designed to stimulate thinking. This analysis is not a recommendation to buy, sell, hold or sell short any security (stock ETF or otherwise)... Read More
Art's Charts November 14, 2012 at 05:21 AM
Stocks continued to struggle as buyers found little reason to bottom pick on Tuesday. Stocks opened lower, surged in morning trade and then moved lower in the afternoon. The major index ETFs finished with small losses on the day... Read More
Art's Charts November 13, 2012 at 06:25 AM
Stocks struggled on Tuesday with the major index ETFs finishing mixed. The Dow Industrials SPDR (DIA) edged higher, but the Russell 2000 ETF (IWM) and Nasdaq 100 ETF (QQQ) edged lower. Apple surged above 550 on the open, but closed below 445 as selling pressure hit... Read More
Art's Charts November 13, 2012 at 06:14 AM
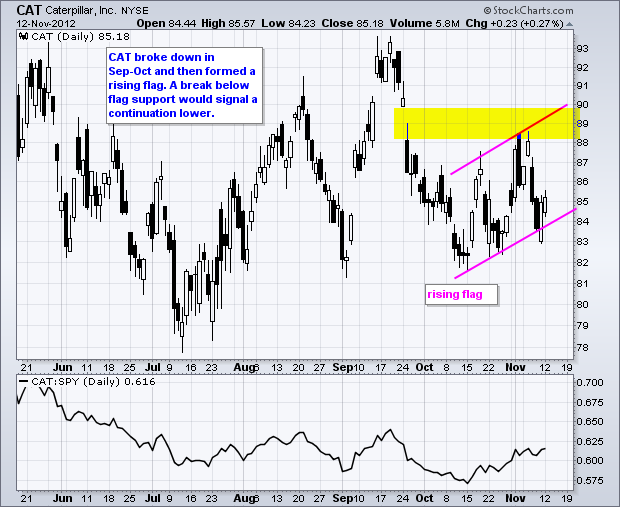
CAT Forms Bear Flag after Breakdown. LXK Triangulates with Bearish Bias. Plus MKC, MMM, RTN, SYK, WOR This commentary and charts-of-interest are designed to stimulate thinking... Read More
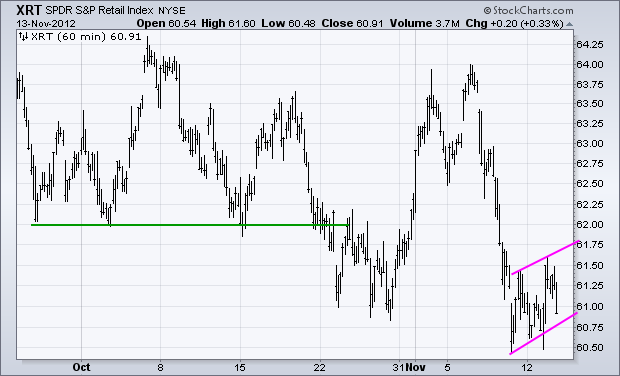
Art's Charts November 12, 2012 at 05:56 AM
It was a rough week for the stock market. The S&P 500 lost 2.43% and all sectors moved lower, even the defensive sectors. The Consumer Discretionary SPDR (XLY) and Technology SPDR (XLK) lost around 2... Read More
Art's Charts November 09, 2012 at 05:57 AM
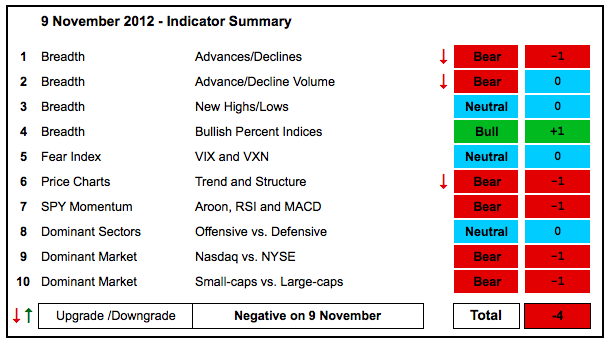
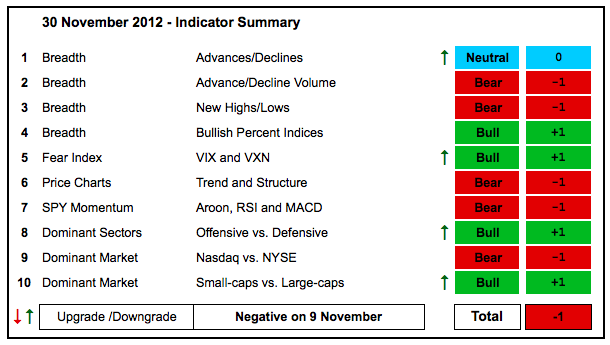
With three downgrades, the indicator summary turned negative for the first time since June. The summary was zero (neutral) the last two weeks. The sharp decline over the last two days was enough to tilt the balance towards the bears... Read More
Art's Charts November 09, 2012 at 04:23 AM
Stocks remained under pressure on Thursday with the major index ETFs falling 1% or more. As has been the case for some time, the Russell 2000 ETF (IWM) and the Nasdaq 100 ETF (QQQ) led the way lower... Read More
Art's Charts November 08, 2012 at 04:47 AM
The markets moved from pre-election risk to post-election fear. Stocks, oil, copper and the Euro moved lower. Treasuries, the Dollar and gold moved higher. Yes, it is rare, and potentially stock market bearish, to see both gold and the Dollar moving higher... Read More
Art's Charts November 08, 2012 at 04:43 AM
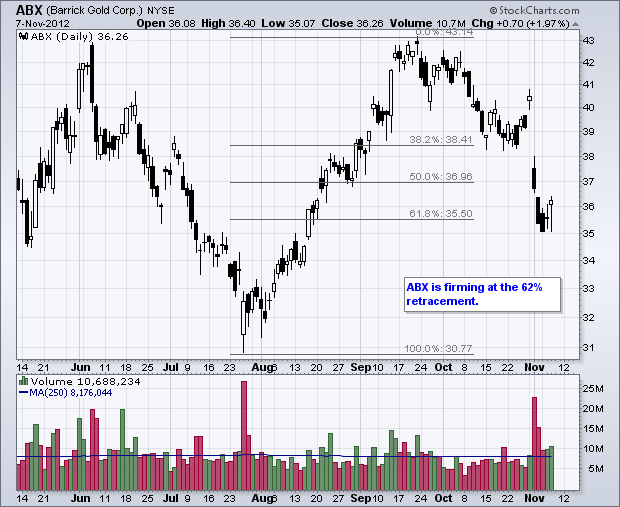
ABX Firms at Key Retracement. ERIC Bucks the Selling Pressure. Plus KGC, SCHW, SWC, TGT This commentary and charts-of-interest are designed to stimulate thinking. This analysis is not a recommendation to buy, sell, hold or sell short any security (stock ETF or otherwise)... Read More
Art's Charts November 07, 2012 at 04:47 AM
The markets embraced a little pre-election risk on Tuesday with the Dow Industrials SPDR (DIA) and S&P MidCap 400 SPDR (MDY) leading the way. The gains were modest, the election is over and investors can now turn to the next big issue (the fiscal cliff?)... Read More
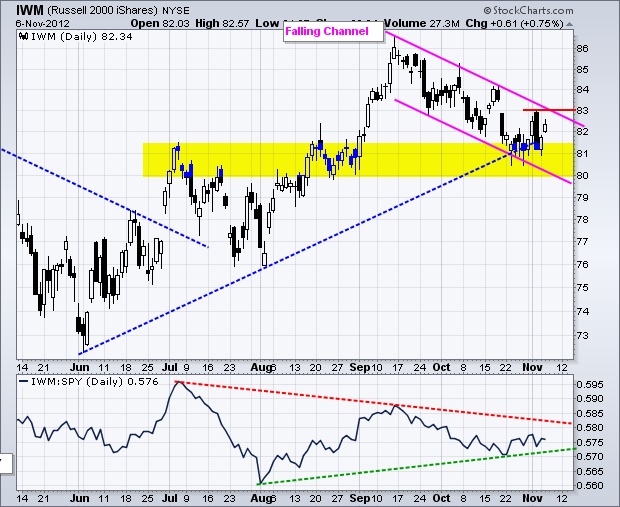
Art's Charts November 06, 2012 at 04:42 AM
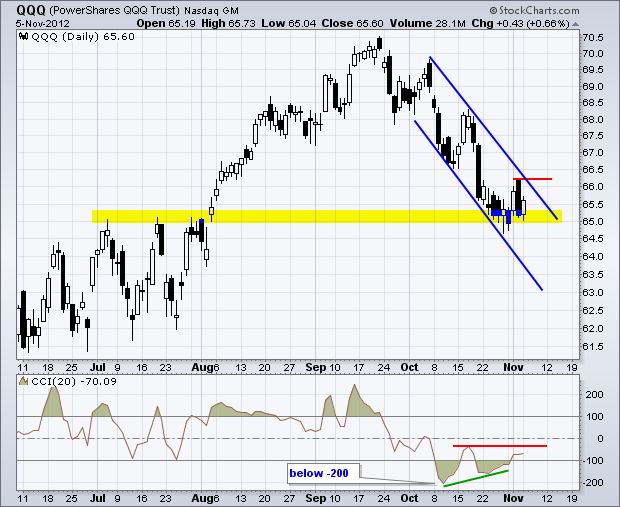
Stocks managed to firm on Monday with small gains in the major index ETFs. The Nasdaq 100 ETF (QQQ) and Russell 2000 ETF (IWM) led the way (up .66%). Six of the nine sectors were up with the Basic Materials SPDR (XLB) and Energy SPDR (XLE) leading the way... Read More
Art's Charts November 06, 2012 at 04:36 AM
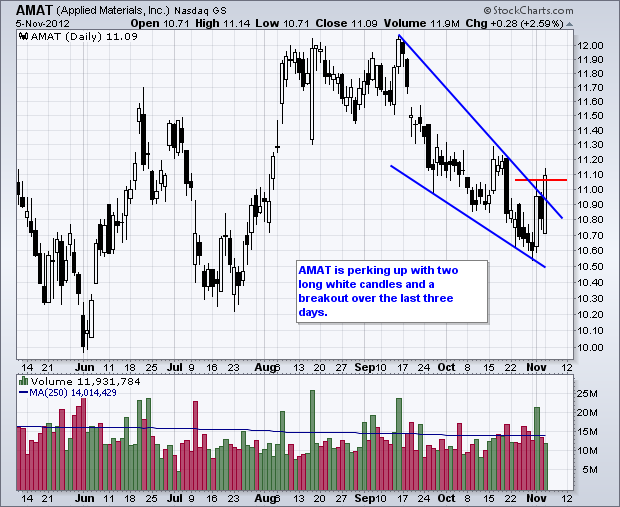
AMAT Breaks Wedge Resistance. ARUM Forms at 50% Retracement. Plus DUK, HUM, MCHP This commentary and charts-of-interest are designed to stimulate thinking. This analysis is not a recommendation to buy, sell, hold or sell short any security (stock ETF or otherwise)... Read More
Art's Charts November 05, 2012 at 05:40 AM
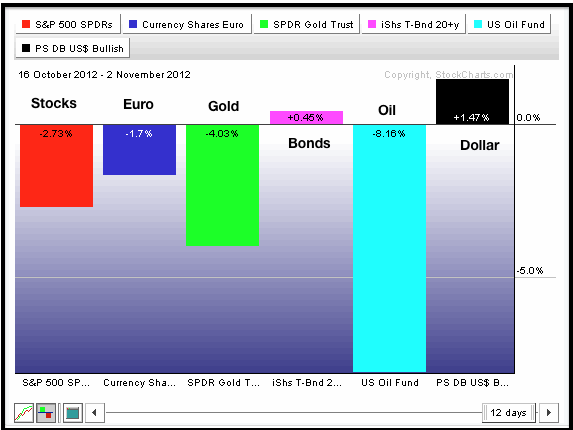
Markets move to risk-off mode in mid October. Since October 16th, the S&P 500 ETF is down 2.73%, the Euro Currency Trust (FXE) is down 1.7%, the US Oil Fund (USO) is down a whopping 8.16% and the Gold SPDR (GLD) is down 4.03%... Read More
Art's Charts November 02, 2012 at 07:31 AM
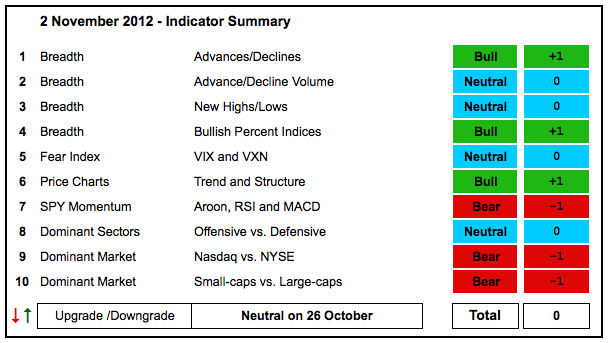
The indicator summary remains neutral. Weakness in the Nasdaq weighed on the Nasdaq AD Volume Line and the technology sector, both of which are bearish. Strength in the finance sector kept the NYSE AD Line strong and NYSE Net New Highs remain positive... Read More
Art's Charts November 02, 2012 at 05:56 AM
Better than expected data on the economy lifted stocks and punished treasuries. The ISM Manufacturing Index rose to 51.7 in October. Anything above 50 favors economic expansion... Read More
Art's Charts November 01, 2012 at 06:31 AM
Stocks are holding their breath ahead of an economic avalanche and presidential election. Today we can expect the ADP Employment Report, Challenger Job Report, Jobless Claims, ISM Manufacturing Index, Construction Spending, Consumer Confidence and Auto/Truck Sales... Read More
Art's Charts November 01, 2012 at 06:27 AM
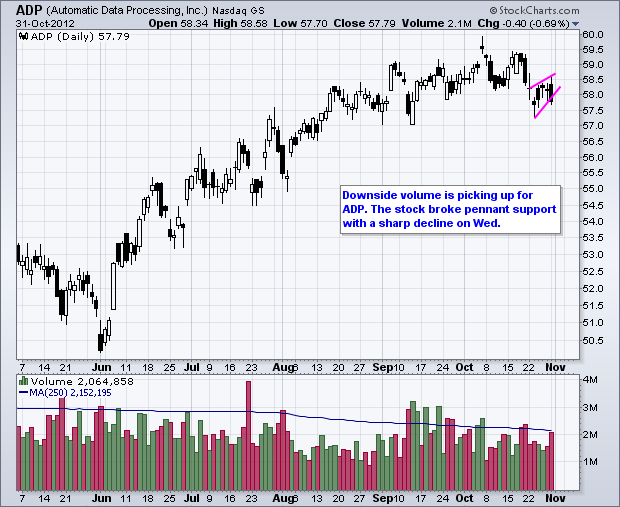
ADP Breaks Pennant Support. AEE Bounces off Support with Good Volume. Plus BDX, BWA, DUK, ESRX, JCP, PAYX This commentary and charts-of-interest are designed to stimulate thinking... Read More