Art's Charts October 29, 2012 at 07:09 AM
First, note that the NYSE and Nasdaq are closed on Monday because of hurricane Sandy. I am going to review some daily charts to offer a little more perspective today. After a rough start to the week, stocks managed to firm the last three days. Firmness is one thing... Read More
Art's Charts October 26, 2012 at 05:17 AM
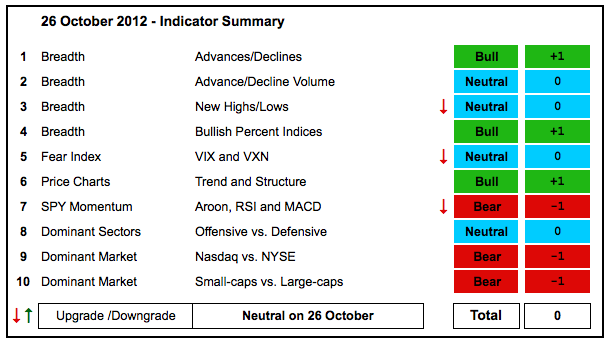
The indicator summary reflects the split nature of the stock market. The finance sector is strong, but the technology sector is weak, very weak. The consumer discretionary and industrials sectors are holding the line though... Read More
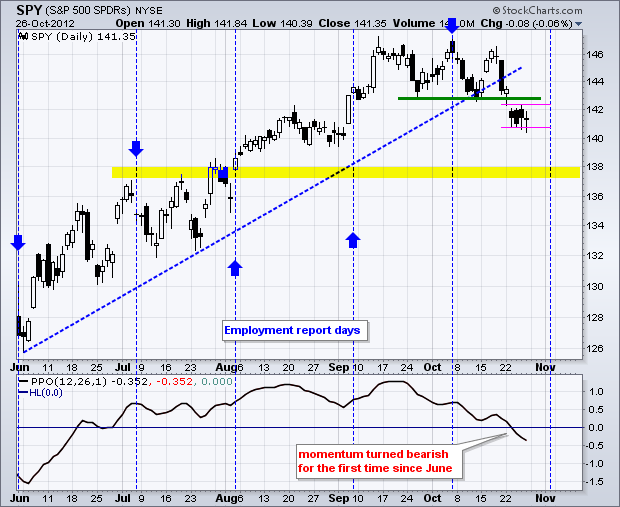
Art's Charts October 26, 2012 at 04:19 AM
Stocks managed to eek out small gains on Thursday as the Russell 2000 ETF (IWM) advanced .41% and the Nasdaq 100 Equal-Weight ETF (QQEW) added .52%. Note, however, that the Nasdaq 100 ETF (QQQ) closed down a fraction (.01%)... Read More
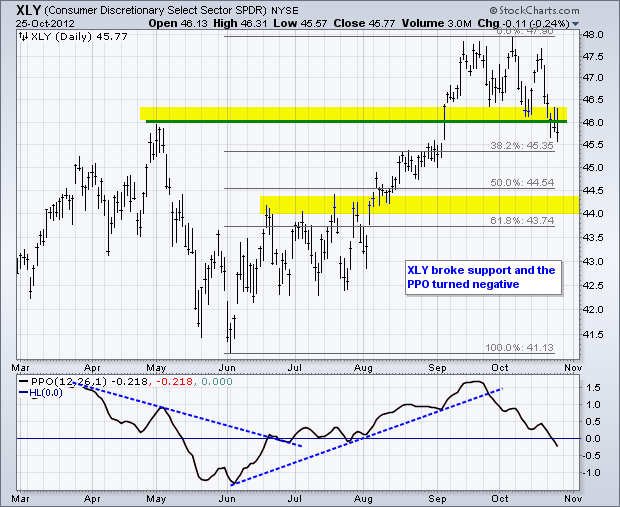
Art's Charts October 25, 2012 at 04:40 AM
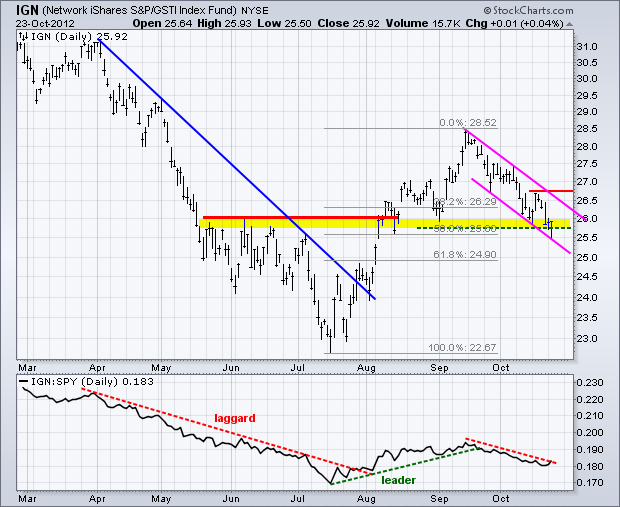
Stocks remained under pressure on Wednesday, but the losses were relatively muted. Techs were again under pressure with declines in the Semiconductor SPDR (XSD), Networking iShares (IGN) and FirstTrust Internet ETF (FDN)... Read More
Art's Charts October 25, 2012 at 04:30 AM
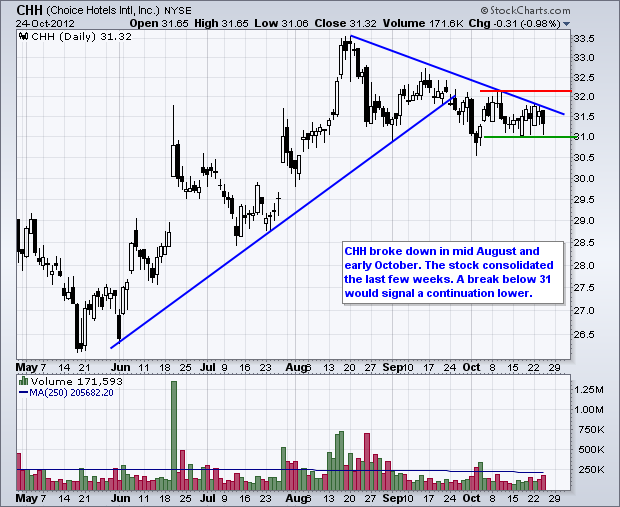
CHH Consolidates after Breakdown. IMAX Forms Bull Flag after Surge. Plus CTSH, F, LXK This commentary and charts-of-interest are designed to stimulate thinking. This analysis is not a recommendation to buy, sell, hold or sell short any security (stock ETF or otherwise)... Read More
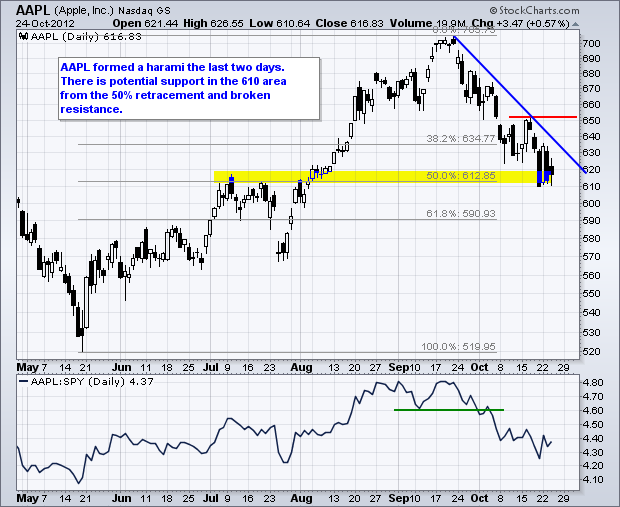
Art's Charts October 24, 2012 at 05:48 AM
Stocks were hit with selling pressure on Tuesday, but there were some pockets of strength in the technology sector. The Dow Industrials SPDR (DIA) led the way lower with a 1.77% decline. The Russell 2000 ETF (IWM) held up the best with a .50% decline. Go figure... Read More
Art's Charts October 23, 2012 at 04:48 AM
Stocks meandered around on Monday as trading turned quite mixed. The Nasdaq 100 ETF (QQQ) edged higher, while the S&P MidCap 400 SPDR (MDY) edged lower. Apple caught a bid ahead of its earnings report on Thursday... Read More
Art's Charts October 23, 2012 at 04:33 AM
Careful out there. It is earnings season. CAH Forms Bear Flag after Breakdown DAL Forms Pennant after Breakout. Plus HAS, NKE, TSN This commentary and charts-of-interest are designed to stimulate thinking... Read More
Art's Charts October 22, 2012 at 04:49 AM
It was another rough week for the stock market, especially tech stocks. Even though the S&P 500 ETF (SPY) remains within a consolidation pattern since mid September, the Nasdaq 100 ETF (QQQ) is in a clear downtrend with a 6+ percent decline from its mid September high... Read More
Art's Charts October 19, 2012 at 05:55 AM
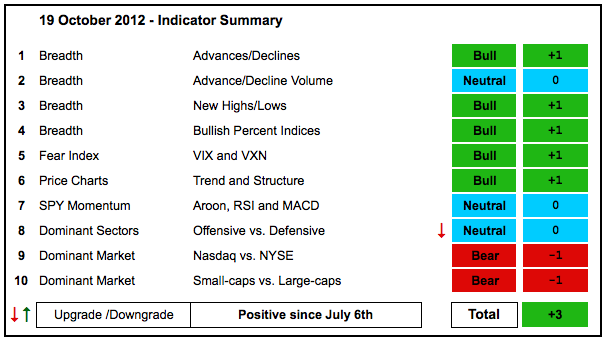
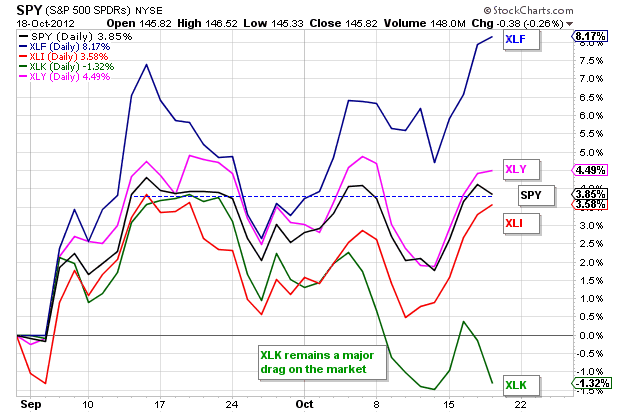
The indicator summary weakened a little big more because I downgraded SPY momentum to neutral. The market is clearly split with relative weakness in the technology weighing on the Nasdaq and relative strength in the finance sector helping the NYSE... Read More
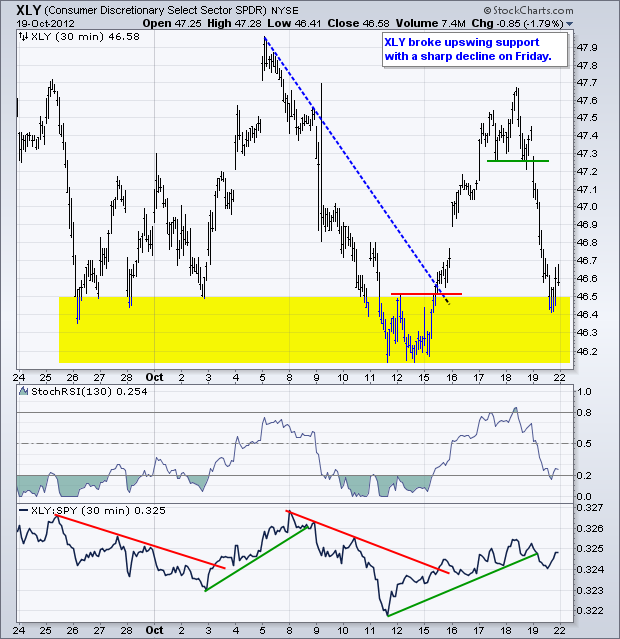
Art's Charts October 19, 2012 at 04:53 AM
Tech stocks got whacked again as Google and Microsoft came up short on their earnings reports. The trend in worse-than-expected earnings continues, especially for tech companies and especially for tech companies tied to the PC (Microsoft, Intel, AMD, Checkpoint, HP)... Read More
Art's Charts October 18, 2012 at 06:19 AM
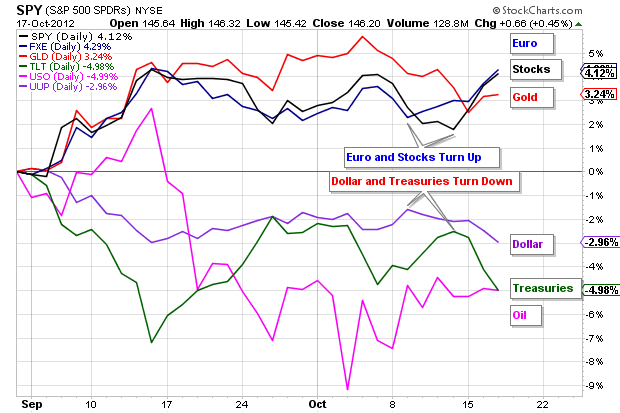
The markets moved from risk-off mode last week to risk-on mode this week. Perhaps the markets are like the weather. Don't like the trend? Wait a day or two and it will change. Trading has been quite volatile the last few weeks and we could see another mood shift... Read More
Art's Charts October 18, 2012 at 06:11 AM
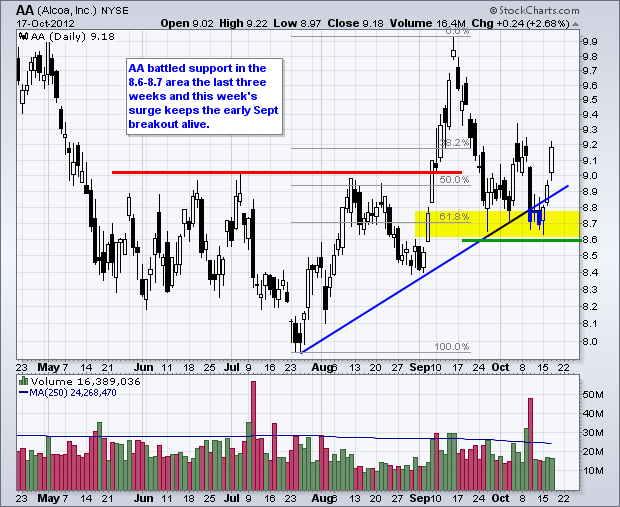
Careful out there. Earnings season is upon us. AA Battle and Hold Support. HBAN Surges within Consolidation. Plus KO, MGM, MOS, POT, SYMC This commentary and charts-of-interest are designed to stimulate thinking... Read More
Art's Charts October 17, 2012 at 04:21 AM
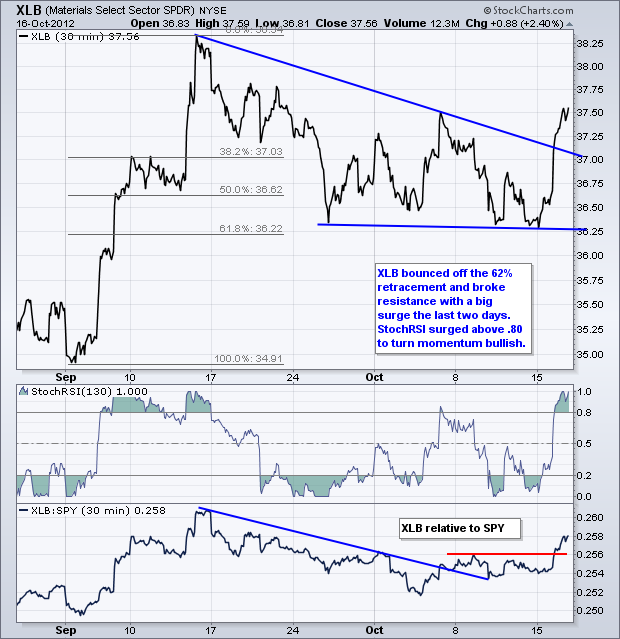
Stocks extended their oversold bounce with the Nasdaq 100 ETF (QQQ) leading the way. QQQ was one of the hardest hit and subsequently got the biggest rebound. All sectors were up with Basic Materials SPDR (XLB) surging 2.4% on the day... Read More
Art's Charts October 16, 2012 at 06:14 AM
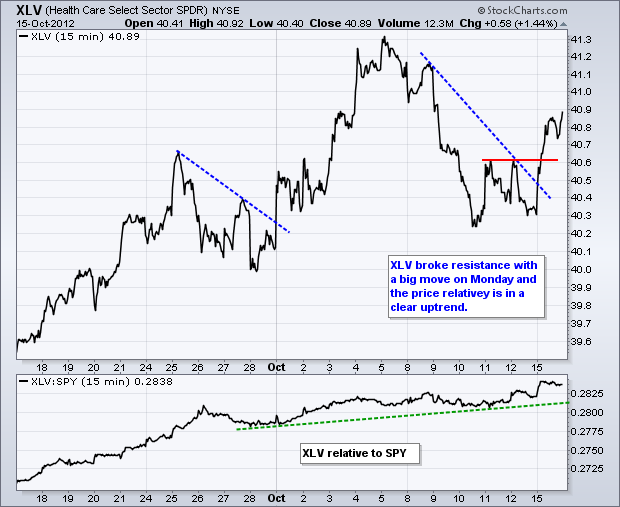
Stocks got an oversold bounce on Monday with the S&P MidCap 400 SPDR (MDY) leading the charge. Mid-caps occupy a certain sweet spot in the market because they are not too big and not too small... Read More
Art's Charts October 16, 2012 at 06:08 AM
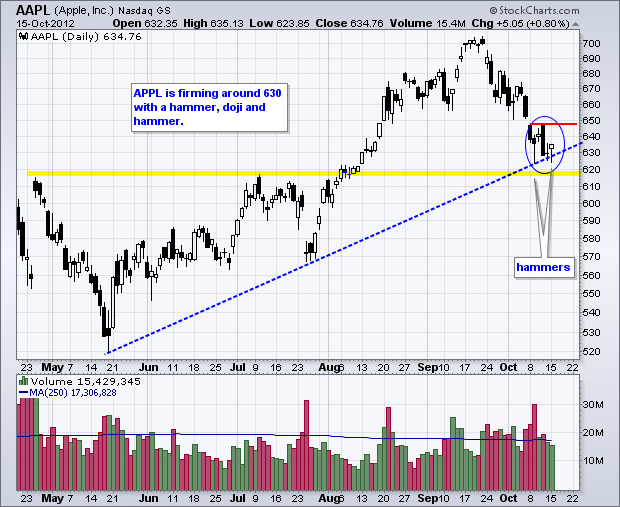
Careful out there. Earnings season is in full swing. AAPL Forms Second Hammer. TXN Gaps and Gains on High Volume. Plus GRMN, JBLU, PMTC, SRCL. This commentary and charts-of-interest are designed to stimulate thinking... Read More
Art's Charts October 15, 2012 at 04:41 AM
Stocks moved lower last week with the S&P 500 ETF (SPY) falling over 2%, which was the steepest decline since May. The Nasdaq 100 ETF (QQQ) lost 3.33% as large techs really took it on the chin... Read More
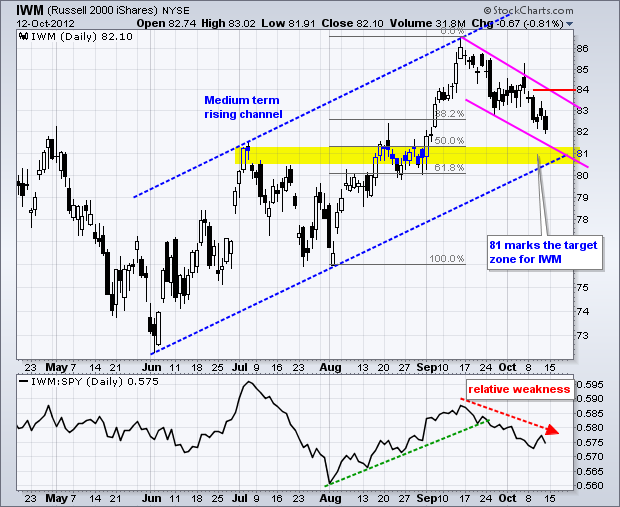
Art's Charts October 12, 2012 at 05:36 AM
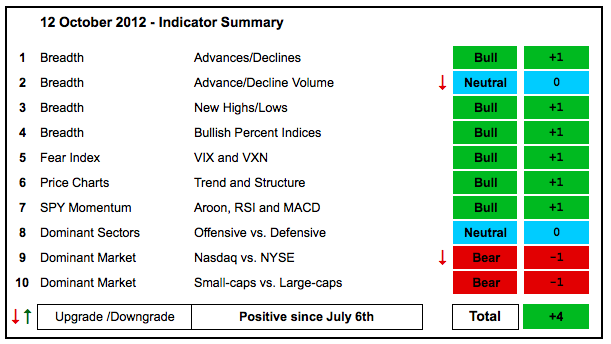
The indicator summary remains positive overall, but there are clearly some bearish undercurrents at work. Namely, the Nasdaq and technology sector are underperforming and showing relative weakness... Read More
Art's Charts October 12, 2012 at 04:20 AM
Stocks started the day strong, but selling pressure took hold and the market finished mixed. Just how mixed? The Nasdaq 100 ETF (QQQ) edged lower (-.31%), but the Nasdaq 100 Equal-Weight ETF (QQEW) edged higher (+.35%). The sectors were also mixed with six up and three down... Read More
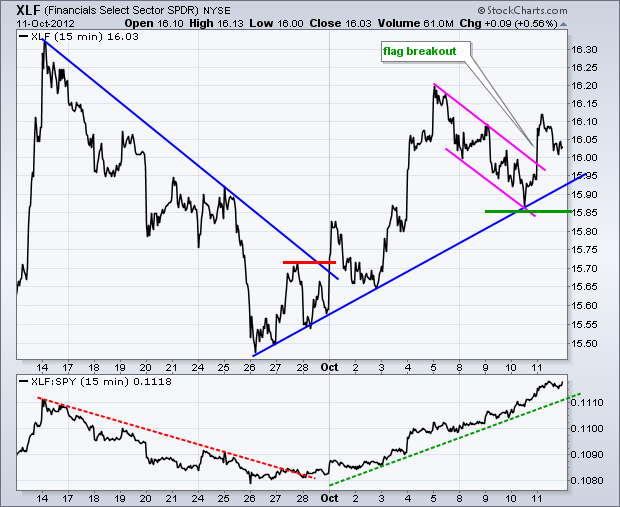
Art's Charts October 11, 2012 at 05:40 AM
Stocks took it on the chin again with more selling pressure on Wednesday. The declines were modest with the Dow Industrials SPDR (DIA) falling around 1% and the Russell 2000 ETF (IWM) falling just .16%... Read More
Art's Charts October 11, 2012 at 05:28 AM
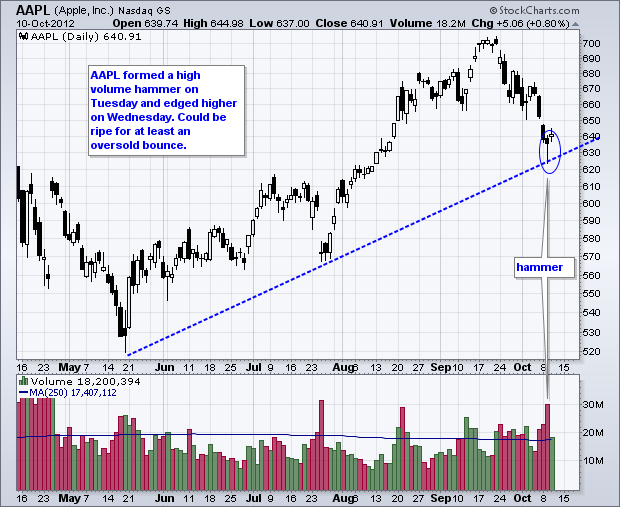
Be careful with stocks about to report earnings. AAPL Forms High Volume Hammer. AIV Surges off Support with Good Volume. Plus AMT, BHP, CNL, LM, PEP This commentary and charts-of-interest are designed to stimulate thinking... Read More
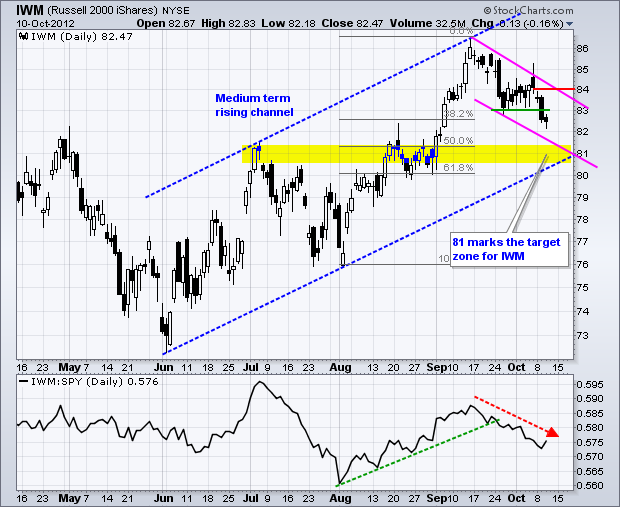
Art's Charts October 10, 2012 at 04:26 AM
Stocks got smacked hard on Tuesday with the Nasdaq 100 ETF (QQQ) again leading the way down. The Russell 2000 ETF (IWM) was also relatively weak with a 1.17% decline on the day. Eight of the nine sectors were lower with the Consumer Discretionary SPDR (XLY) falling the most... Read More
Art's Charts October 09, 2012 at 05:48 AM
Stocks edged lower with the Apple-laden Nasdaq 100 ETF (QQQ) leading the way (-.95%). The Russell 2000 ETF (IWM) was also relatively weak with a .63% decline on the day. Seven of the nine sectors were lower with the Technology SPDR (XLK) falling over 1%... Read More
Art's Charts October 09, 2012 at 05:44 AM
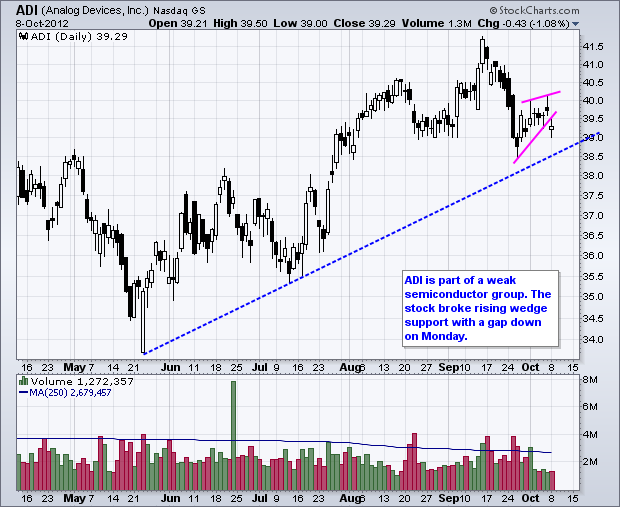
ADI Gaps Below Wedge Support. VALE Bounces off Key Retracement with Big Volume. Plus AKS, ANF, CLF, NUE, PMTC, RHT, SO, YUM This commentary and charts-of-interest are designed to stimulate thinking... Read More
Art's Charts October 08, 2012 at 06:23 AM
It was a fairly good week for the bulls. The S&P 500 ETF (SPY) and Dow Industrials SPDR (DIA) gained around 1.5%. The Finance SPDR (XLF) led the way with a 3% gain. The Consumer Discretionary SPDR (XLY) and the Industrials SPDR (XLI) also performed well with ±1.75% gains... Read More
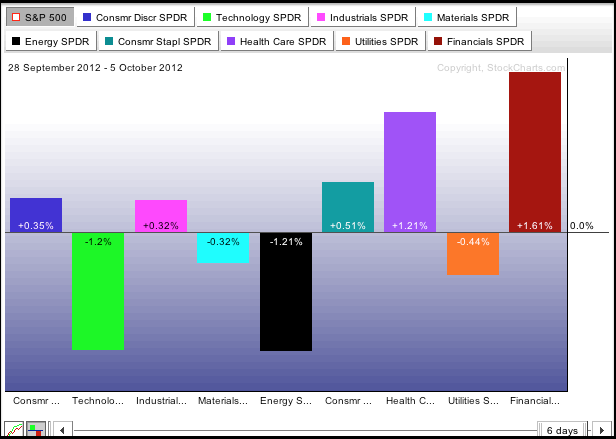
Art's Charts October 05, 2012 at 05:15 AM
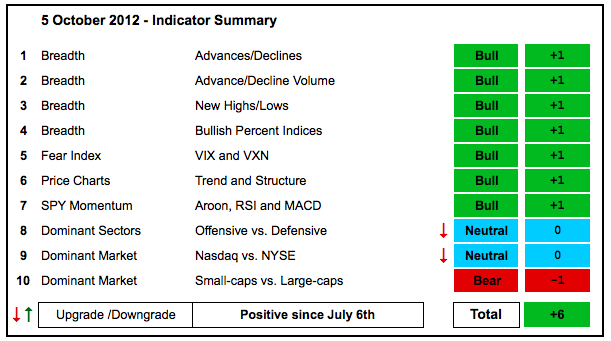
The bulk of the evidence remains bullish, but there were two downgrades based on relative weakness in the technology sector... Read More
Art's Charts October 05, 2012 at 04:22 AM
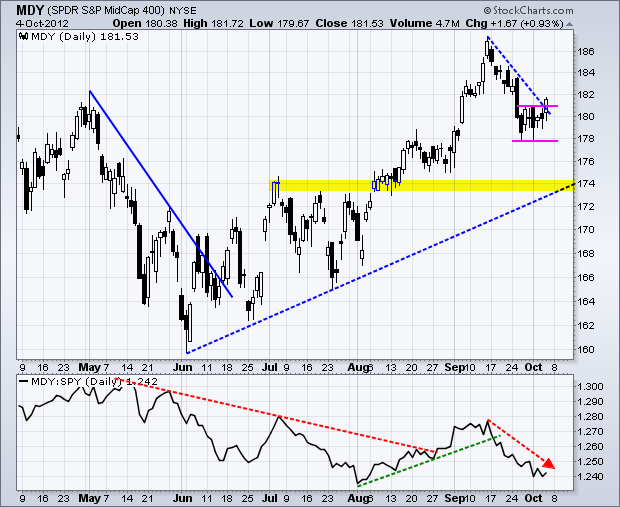
The markets moved to risk-on mode on Thursday as stocks edged higher, treasuries fell, oil surged around 5%, the Dollar fell and the Euro rose. And now for the employment report. The major index ETFs moved modestly higher with the S&P MidCap 400 SPDR (MDY) leading the way (+1... Read More
Art's Charts October 04, 2012 at 06:45 AM
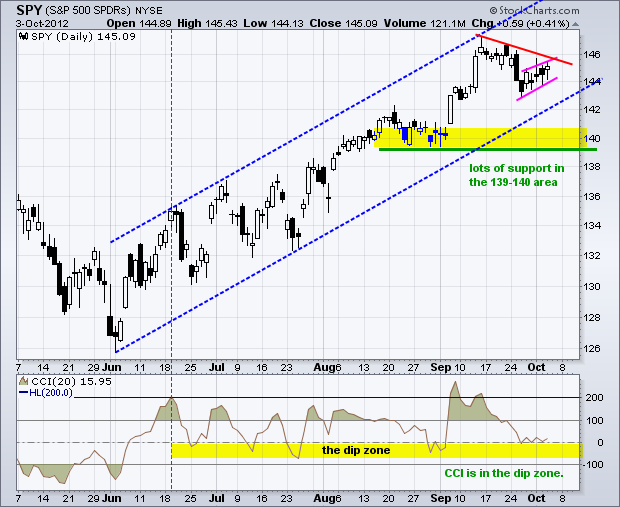
I get the feeling that this market does not want to go down. As with late August, the major index ETFs underwent a mild correction the last three weeks. There was a sharp decline last week, but selling pressure dried up and stocks firmed the last three days... Read More
Art's Charts October 04, 2012 at 06:41 AM
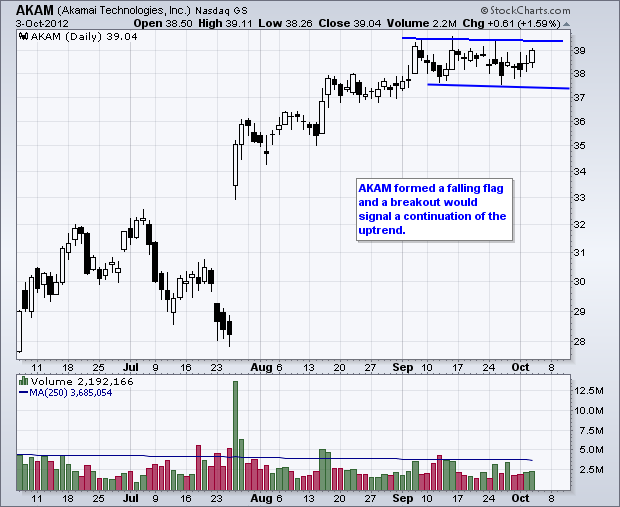
AKAM Forms Bullish Flag. SYMC Falls to Support on High Volume. Plus HAS, ISRG, SNDK This commentary and charts-of-interest are designed to stimulate thinking. This analysis is not a recommendation to buy, sell, hold or sell short any security (stock ETF or otherwise)... Read More
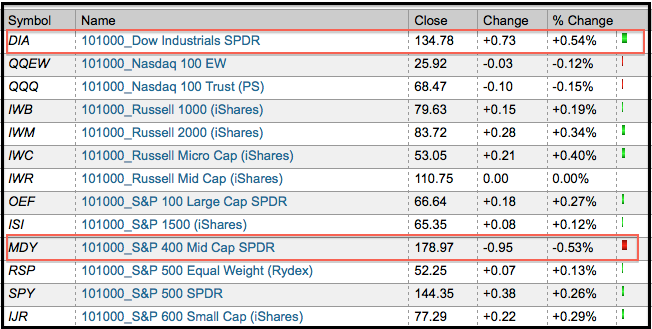
Art's Charts October 03, 2012 at 04:11 AM
Strange, and indecisive days, continued as the Dow Industrials SPDR (DIA) edged lower and the S&P MidCap 400 SPDR (MDY) edged higher. Stocks were about as mixed as can be on Tuesday. Six of the nine sectors were up, but the biggest gain was just ... Read More
Art's Charts October 02, 2012 at 06:29 AM
Monday was a strange day indeed. Stocks were truly mixed with the Dow Industrials SPDR (DIA) advancing around 1/2% and the S&P MidCap 400 SPDR (MDY) declining the same amount. It is definitely a strange day when two relatively broad indices move in opposite directions... Read More
Art's Charts October 02, 2012 at 05:48 AM
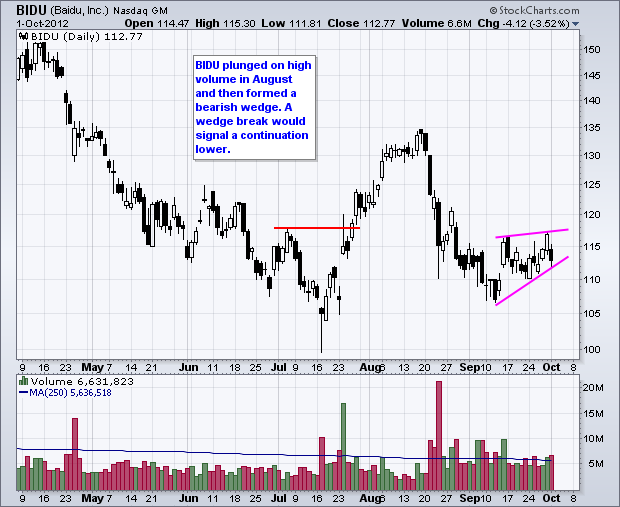
BIDU Forms Bearish Wedge. CHKP Shows Relative Weakness as Downside Volume Increases. Plus FAST, LXK, MAT, PCP, SWY This commentary and charts-of-interest are designed to stimulate thinking... Read More
Art's Charts October 01, 2012 at 04:43 AM
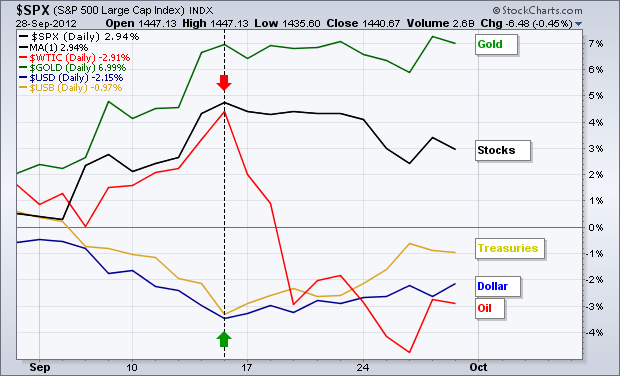
Strength in the Dollar and US Treasuries remains a negative for the stock market. Even though these uptrends are still relatively short, continued strength in the Dollar and Treasuries would weigh further on stocks... Read More