 The broader market may not seem bullish right now, but there is clearly a bull market somewhere within stocks. In particular, the S&P 500 and Nasdaq 100 are currently within five percent of all time highs, which were hit just five weeks ago. Moreover, they held well above their early June lows during the August dip and are clearly in uptrends overall. This tells me that there are pockets of strength within the S&P 500, serious pockets.
The chart below shows the six biggest sectors in the S&P 500, which account for some 78% of the index. First, note that the Technology SPDR (XLK), the Consumer Discretionary SPDR (XLY) and the Communication Services SPDR (XLC) hit 52-week highs in late July. Second, notice that these three held above their early June lows during the August pullback. These sector price charts still sport uptrends and still support the uptrend in the S&p 500.
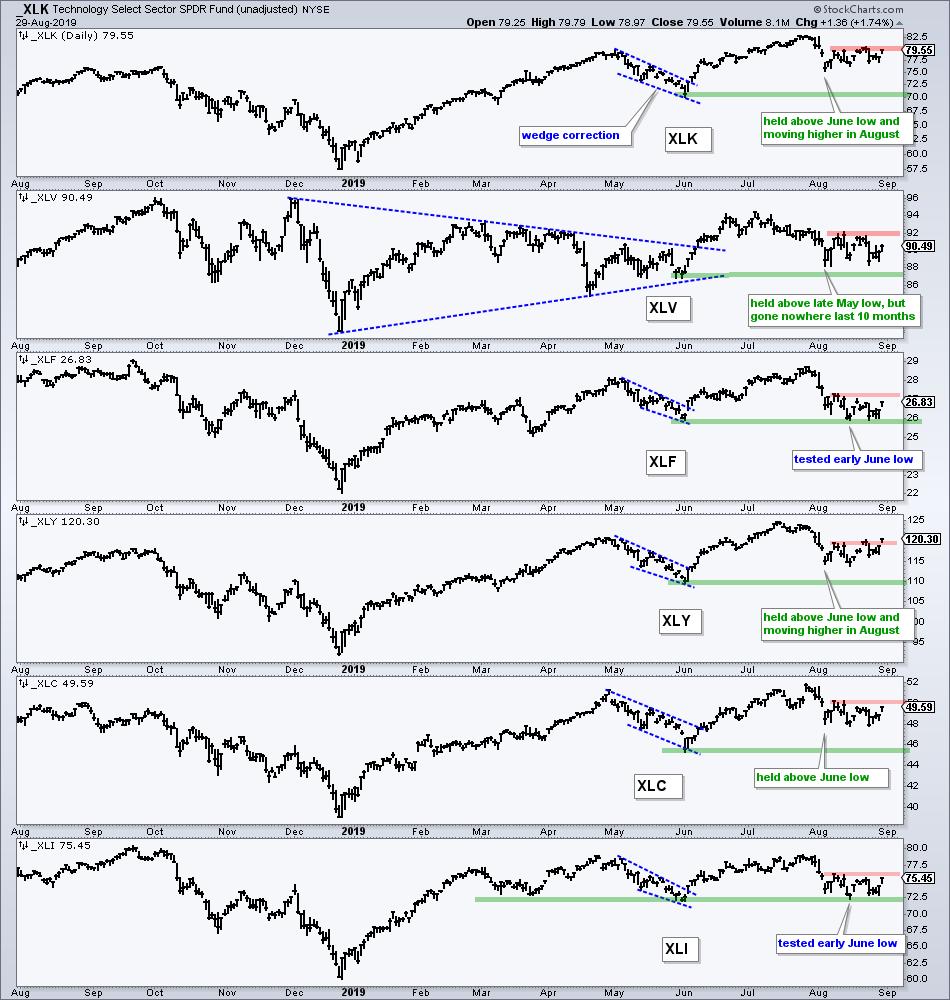
The Financials SPDR (XLF) and Industrials SPDR (XLI) were hit harder in August as both tested the early June lows (green lines). However, they did not break these lows and bounced off these support zones on Thursday. Thus, XLI and XLF, while not as strong as the first three sectors, have yet to break important support zones. And finally, the Health Care SPDR (XLV) is neither here nor there because it has been flat the last ten months.
Even though the Utilities SPDR (XLU), the Real Estate SPDR (XLRE) and the Consumer Staples SPDR (XLP) are the leading sectors right now, the Technology SPDR, Consumer Discretionary SPDR and Communication Services SPDR are NOT in downtrends. They are still in uptrends and these sector SPDRs weigh big in the S&P 500. Furthermore, the Industrials SPDR and Financials SPDR are still holding support. Thus, I do not see a bear market for the S&P 500 right now.
------------------------------------------------------------
Are 80% Days the New Norm?
The chart below shows AD Percent for the S&P 500, S&P Mid-Cap 400 and S&P Small-Cap 600. There have been three double/triple 80% up days (green lines) in August and three double/triple 80% down days (red lines). 80% days show strong participation because it means 90% of stocks in the index advanced or declined. A double/triple 80% day occurs when AD Percent exceeds +-80% for two or three of the indexes.
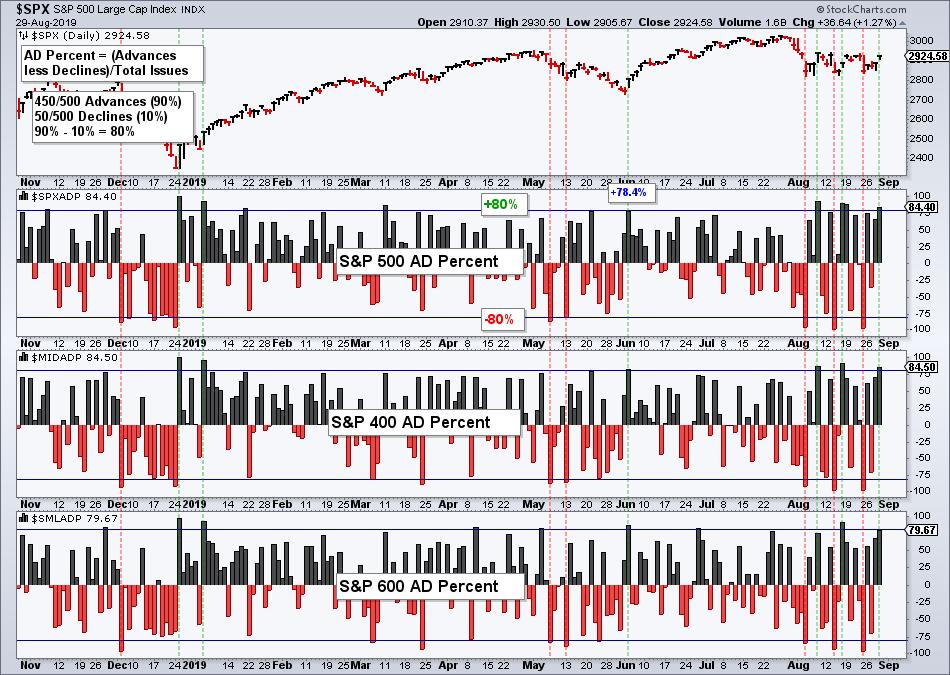
As noted before, these 80% days act as double-edged swords. On one hand, stocks are oversold after a double or triple 80% down day and ripe for a bounce (1-3 days). On the other hand, such broad downside participation is negative and could lead to a corrective period for a few weeks. Note that this August trading range started with a triple 80% down day on August 5th.
The challenge now is that the last three double/triple 80% down days were followed by double/triple 80% up days. Thus, each double/triple day led to a 1-3 day counter bounce and that was it. There was no follow through. Most recently, there was a double 80% up day on Thursday. Will we see follow through? Now let's check the SPY chart.
------------------------------------------------------------
SPY: Home on the Range
The August trading range in the S&P 500 and SPY is the range heard round the world. The whole charting community is talking about it and waiting for the break. The chart below shows SPY trading between 281.72 and 294.15 the entire month. There have been eleven moves greater than 1% and $SPX AD Percent has exceeded +-80% six times. Note that AD Percent exceeded +-80% just five times the prior seven months.
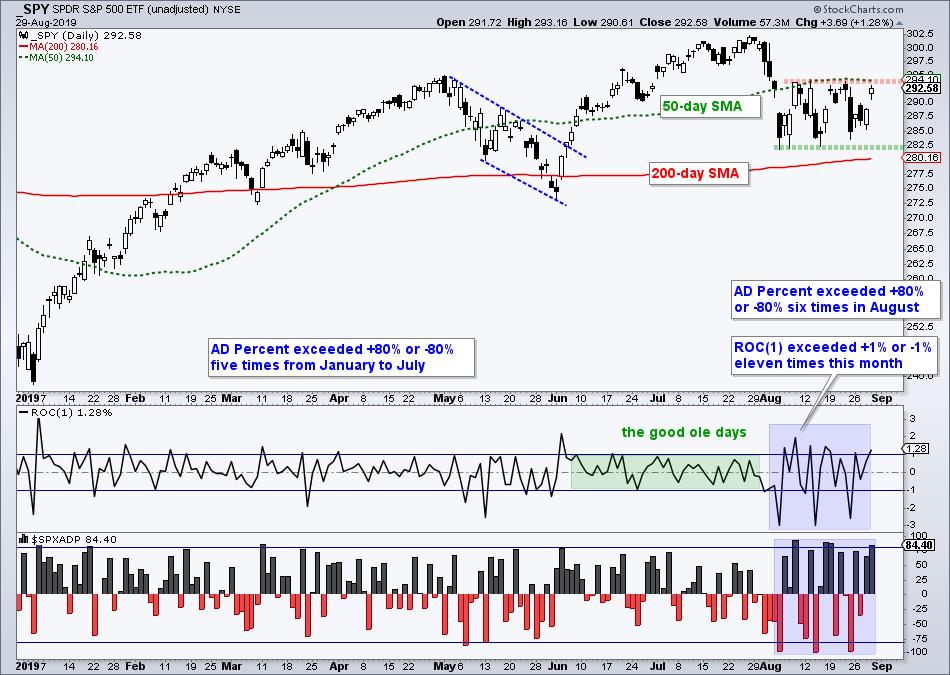
Also notice that the 200-day is just under this range and the 50-day SMA is at the August highs. SPY is sandwiched between two key moving averages. A break above the 50-day would be quite bullish and capture some serious attention, especially if we see strong breadth. This would show follow through to this week 80% up day.
Follow-through, on both the upside and downside, has been lacking during this trading range. And follow-through could hold the key to the next decisive move. We have seen strong 1-2 day moves with one strong breadth day, both up and down. However, we have yet to see a convincing follow-through move.
------------------------------------------------------------
SPY Holds Support Break
We can put the August range (four weeks) into perspective on a weekly chart, which still sports a broadening formation that was discussed at length two weeks ago (here). The broadening formation represents a market that is out of control because of the widening swings. I monitor the swings within the pattern for signals. SPY broke support in the 295 area with a sharp decline in early August and this break held for four weeks as the ETF consolidated under the break.
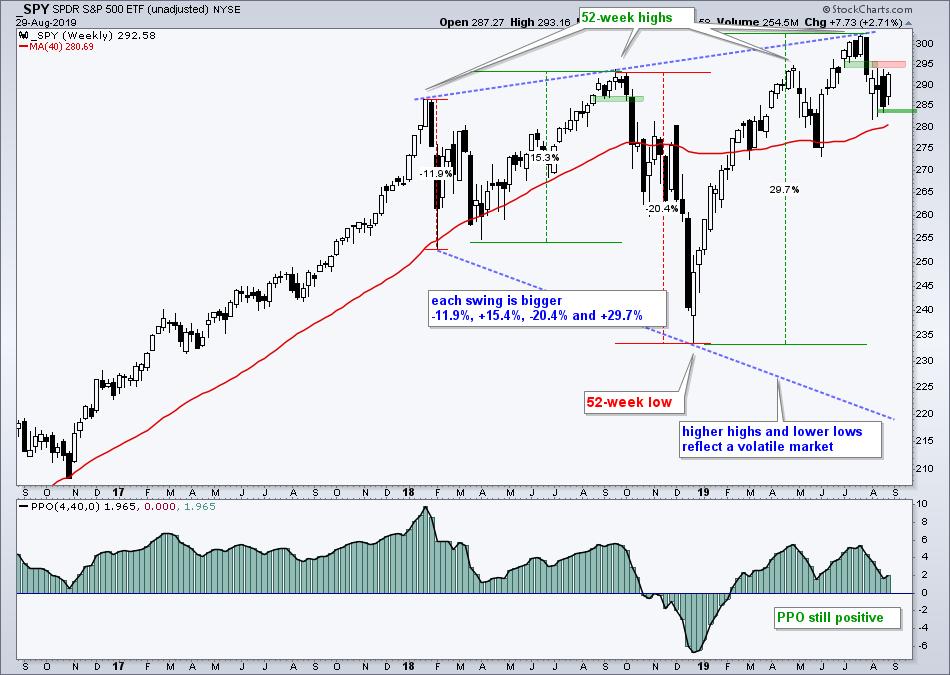
Despite this short-term support break, SPY is above the rising 40-week SMA and the PPO(4,40,0) is positive (4-week EMA above 40-week EMA). In addition, SPY recorded a new high just five weeks ago and held well above the early June low. Downtrends require at least one lower high and one lower low. SPY has neither so the long-term trend is still up. Trouble could start with a weekly close below last week's low (293.47).
------------------------------------------------------------
Large-caps Ok - Small-caps Not
There is no change in the Index Breadth Model. The S&P 500 remains net bullish with two of three bullish signals, while the S&P Mid-Cap 400 and S&P Small-Cap 600 remain net bearish. All told, five of the nine signals are bearish right now.
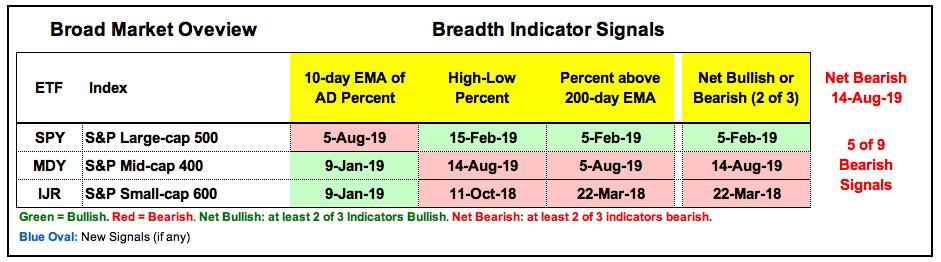
Even though 5 of 9 signals are bearish, this is actually a majority by the minority. Keep in mind that the S&P 500 accounts for some 80% of the total US equity market. If we weighted these signals by market cap, the breadth table would be net bullish. At the very least, we are still seeing a split market. Large-caps are doing fine, but small-caps and mid-caps are struggling.
You can learn more about these indicators with the following links: AD Percent, High-Low Percent, %Above 200-day EMA and YouTube video covers all three.
------------------------------------------------------------
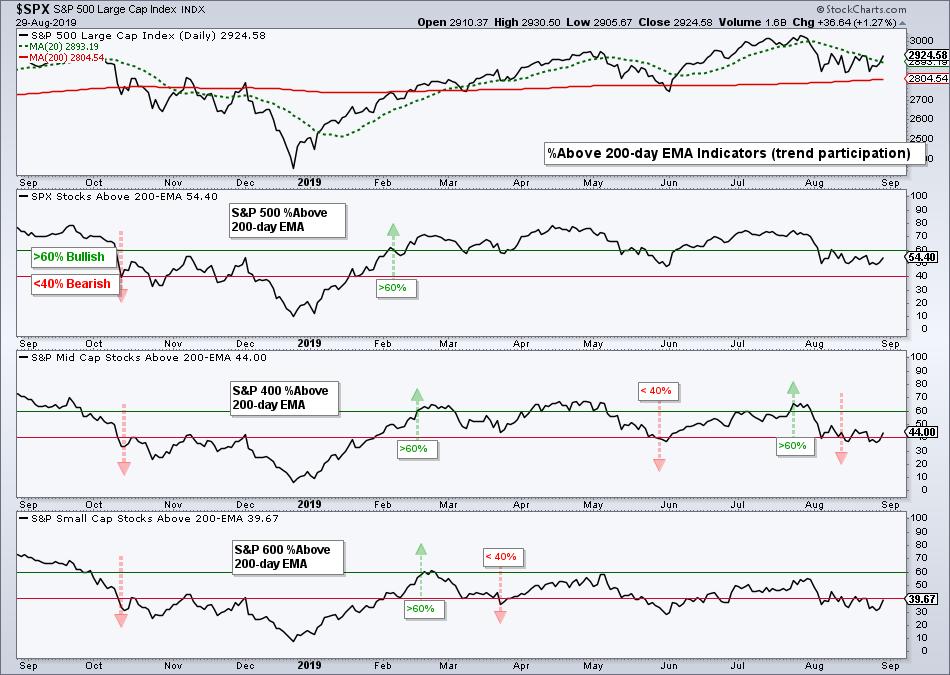
%Above 200-day EMA Shows Mixed Market
Look no further than the %Above 200-day EMA indicator to understand why the broad market is split. Currently, 54.4% of stocks in the S&P 500 (272 stocks) are above their 200-day EMAs, and this is the strongest of the three indexes. Elsewhere, 44% of the S&P Mid-Cap 400 (176 stocks) and 39.67% of the S&P Small-Cap 600 (238) are above their 200-day EMAs. Of the 1500 stocks here, only 686 (45.7%) are above their 200-day EMAs. This means the majority of stocks in the S&P 1500 are below their 200-day EMAs. It is not an overwhelmingly bearish percentage, but it does show plenty of weakness out there.
------------------------------------------------------------
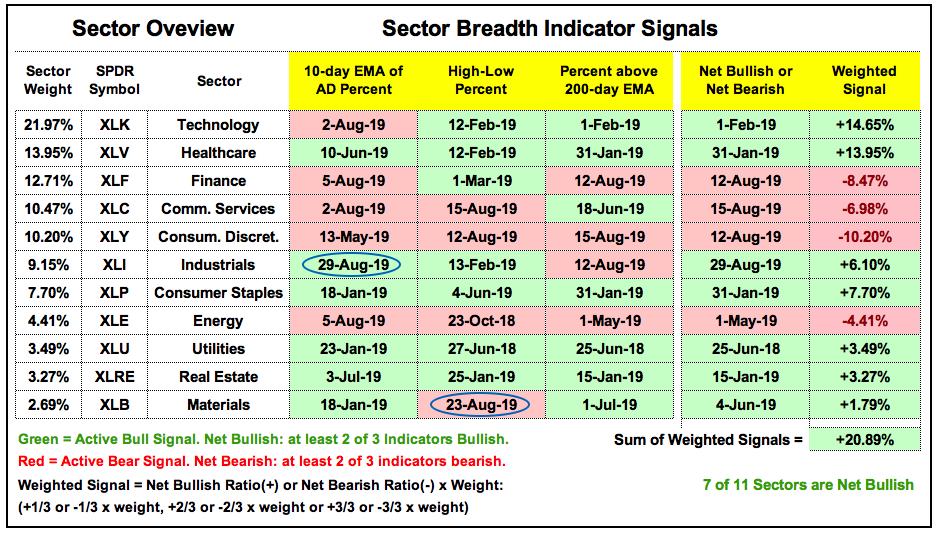
Sector Breadth Model Improves
Industrials flipped from bearish to bullish and the S&P 500 Sector Breadth Model improved this week. Seven of the eleven sectors are net bullish (four of eleven bearish). The sum of the weighted signals stands at +20.89% (-100% to +100% range). This weighted sum did not turn negative in August as the S&P 500 held up fairly well. Even though seven sectors are net bullish, note that Financials SPDR (XLF), Communication Services SPDR (XLC) and Consumer Discretionary SPDR (XLY) are still net bearish and weighing on the broader market.
------------------------------------------------------------
Focus on Industrials Sector
The next chart shows the Industrials SPDR (XLI) with the three breadth indicators: 10-day EMA of Industrials AD% ($XLIADP), XLI High-Low% ($XLIHLP) and Industrials %Above 200-day EMA (!GT200XLI). The green and red arrows on the indicators mark the individual signals, while the arrows on the price plot mark the net bullish and net bearish signals. Notice that the 10-day EMA of AD Percent triggered eight signals, while the other two indicators only triggered five times (combined). The whipsaws reflect price action since March as XLI has gone nowhere for six months.
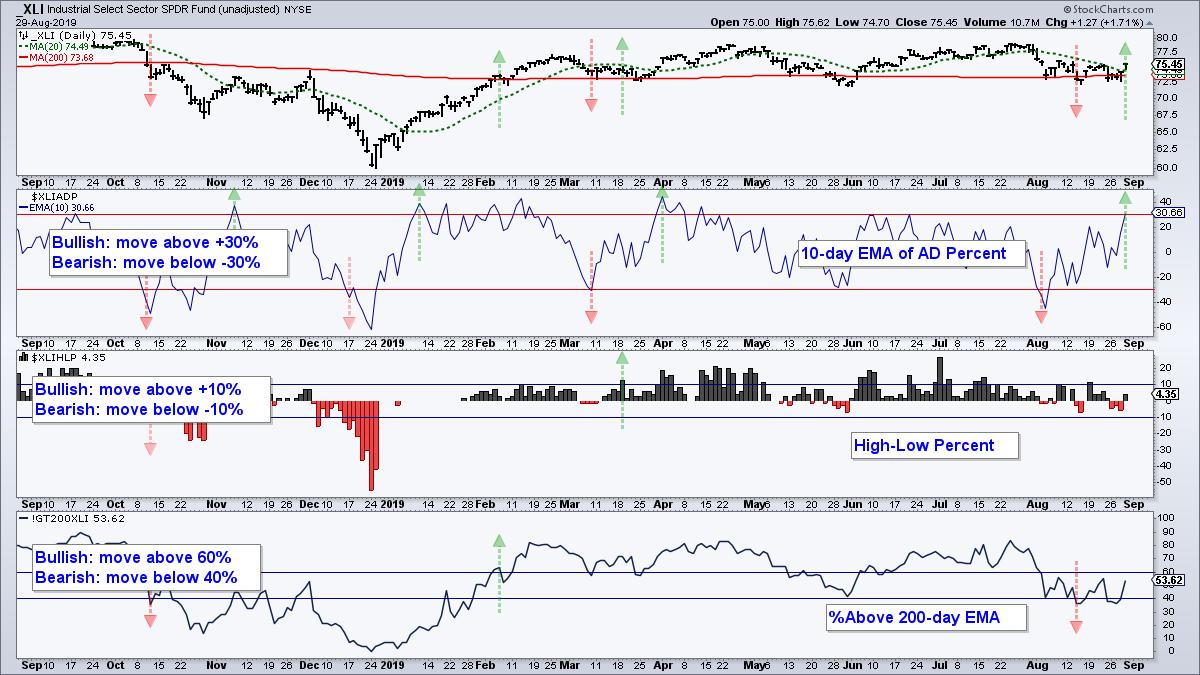
Note that the sector breadth indicators measure the internal strength or weakness within a sector. All stocks are equal when it comes to breadth indicators and these indicators reflect sector performance as a whole. The sector SPDRs, on the other hand, are weighted by market cap and all stocks are NOT created equal. The SPDR price plots reflect the performance of the largest stocks within the sector (large-caps).
------------------------------------------------------------
QQQ Performs, while IWM Lags
The next chart shows the Nasdaq 100 ETF (QQQ) performing in line with SPY because it hit a new high in July, broke short-term support in early August and held above the early June low. QQQ also held above the 40-week SMA.
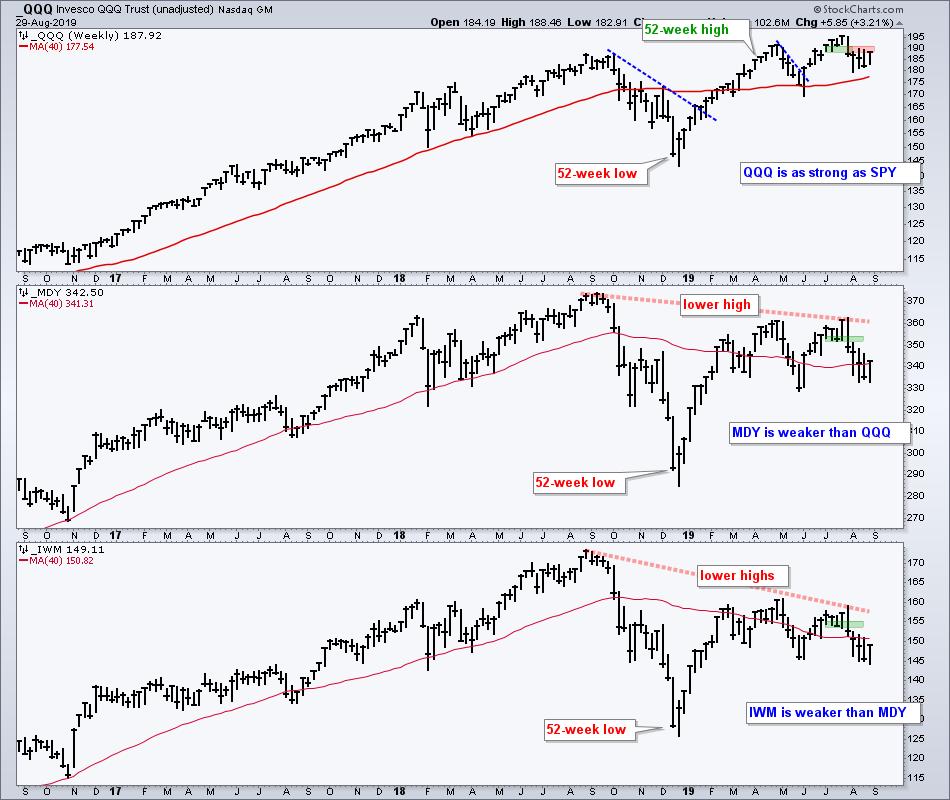
MDY edged above its April high in July, but did not come close to its 2018 high. The 52-week low and lower high remain the dominant long-term features for MDY (bearish). IWM is even worse off with a lower high from late April to late July and a move below the early June low this week.
------------------------------------------------------------
Bottom Line: Bear Market Environment
There is not much change in the broad market environment. Large-caps remain strong and even strengthened this week (SPY and QQQ). Small-caps remain weak overall and lagged in August. Note that SPY and QQQ held above their early August lows, while IWM and IJR forged lower lows the each of the last three weeks.
The Index Breadth Model is net bearish because of small-caps and mid-caps, but the S&P 500 remains net bullish and the Sector Breadth Model is bullish. A true bear market, however, is pretty much impossible without the S&P 500 because it is the 800 pound gorilla in the room.
As noted in Thursday's ETF group rankings, over half of the equity-related ETFs that I follow are in downtrends. These include the Russell 2000 iShares (IWM), the Energy SPDR (XLE), the Retail SPDR (XRT), the Regional Bank SPDR (KRE) and the HealthCare Providers ETF (IHF). However, I also noted that some big and more important ETFs were still in uptrends (SPY, QQQ, XLK, XLY, XLC, SOXX, IGV). They were hit in early August, but these declines started from new highs and the ETFs held above the June lows.
Looking at the market as a whole (small-caps, mid-caps and large-caps), the weight of the evidence is still bearish. However, there are pockets of strength out there so I would not consider the current environment as overwhelmingly bearish. See Thursday's commentary for a list of the strong ETFs.
------------------------------------------------------------
Art's Charts ChartList Update
For the time being, the Art's Charts ChartList contains selection of breadth charts. Click here for the Art's Charts ChartList.
Choose a Strategy, Develop a Plan and Follow a Process
Arthur Hill, CMT
Chief Technical Strategist, TrendInvestorPro.com
Author, Define the Trend and Trade the Trend
Want to stay up to date with Arthur's latest market insights?
– Follow @ArthurHill on Twitter


