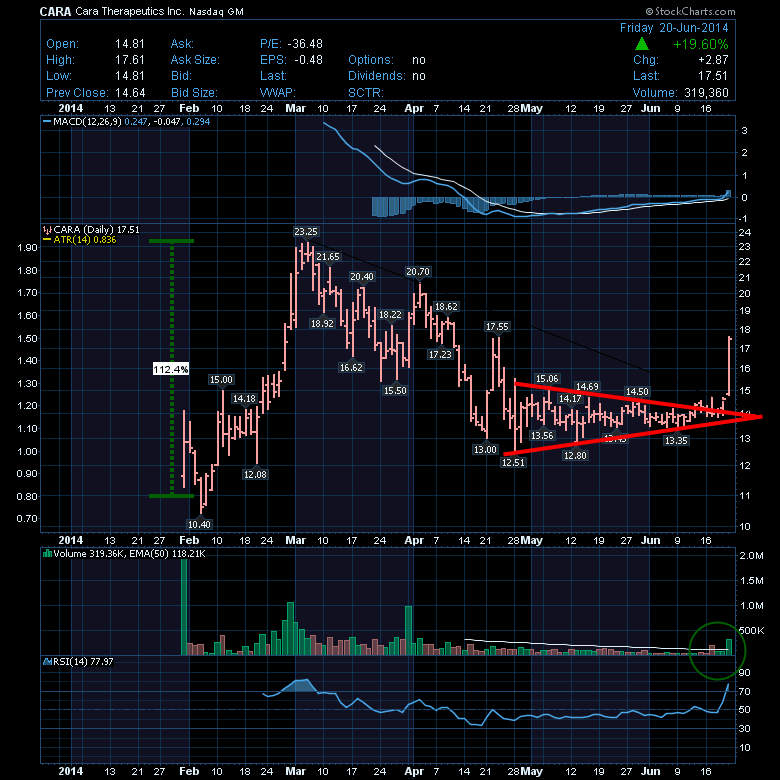
Cara Therapeutics (CARA) started trading in late January 2014. The IPO priced at $11.00 with 5,000,000 shares for float.
The stock rocketed out of the gate and went on to double by March 1, 2014 trading. After that, CARA sold off over the next two months all the way back down to the mid $12 range.
The chart then went almost horizontal for 2 months, only to jump 4% Thursday on news and 20% on no additional news Friday. What is an investor to think?
First of all, this may be physically impossible to trade on fundamentals as an early stage lab. I read the press release from Wednesday and it was written by a PhD. for PhD's. It was of no help for me to understand why everyone got so passionate on the stock.
Here is the press release. Cara Press Release. It sounds like they started a Phase 1 trial. If I ignore the news, what is the chart telling us?
First of all, it reminds me of the base in a Wyckoff study. Let's look at that point of view. Here is a link to the StockCharts ChartSchool Article on Wyckoff. This is another description from the MTA knowledge base. Here is a link to the MTA Knowledge Base on Wyckoff. Here is a theoretical chart showing the accumulation phase according to Wyckoff from the MTA link.
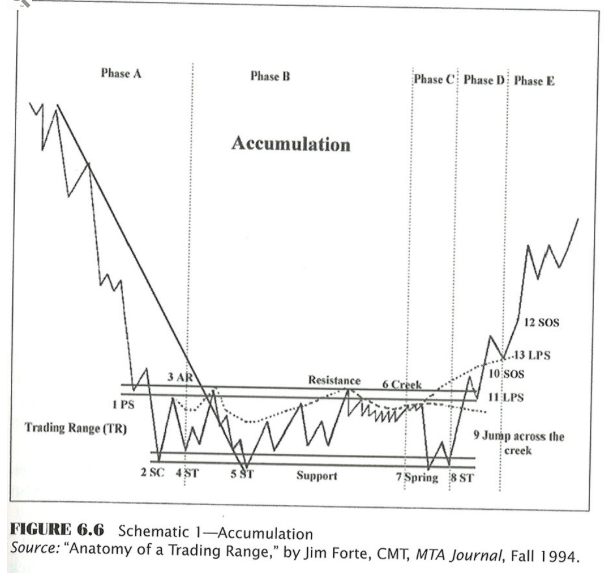
We have a very similar pattern. Moving to the other article I linked above, the ChartSchool article mentions:
Wyckoff focused exclusively on price action. Earnings and other fundamental information were simply too esoteric and imprecise to be used effectively. Moreover, this information was usually already factored into the price by the time it became available to the average speculator. Before looking at the details, there are two rules to keep in mind. These rules come directly from the book, Charting the Stock Market: The Wyckoff Method, by Jack K. Hutson, David H. Weiss and Craig F. Schroeder.
Rule One: Don't expect the market to behave exactly the same way twice. The market is an artist, not a computer. It has a repertoire of basic behavior patterns that it subtly modifies, combines and springs unexpectedly on its audience. A trading market is an entity with a mind of its own.
Rule Two: Today's market behavior is significant only when it's compared to what the market did yesterday, last week, last month, even last year. There are no predetermined, never-fail levels where the market always changes. Everything the market does today must be compared to what it did before.
Instead of steadfast rules, Wyckoff advocated broad guidelines when analyzing the stock market. Nothing in the stock market is definitive. After all, stock prices are driven by human emotions. We cannot expect the exact same patterns to repeat over time. There will, however, be similar patterns or behaviors that astute chartists can profit from. Chartists should keep the following guidelines in mind and then apply their own judgments to develop a trading strategy.
We did not get the final flush or "Spring", like the points 7 and 8 represent. We did get the "jump across the creek".
I would define what we see on the chart as "textbook" accumulation. So after a period of accumulation, the stock has broken out. Is it too late to get in? Is it too late to add? Is it time to sell?
First of all, biotech is a roller coaster. I met a trader in London who had made and lost over a million in biotech. This stock should be treated the same. It could take or make your trading year if your position size is too big. If your position size is set right, you should be able to trade the stock without emotion.
As an example, setting a floor price of 1/2 way down the last candle, call it just under $16.00 should allow for a level of support for the stock. If that fails to hold, you probably want to exit the stock. If the stock continues to run, you must use trailing stops to keep your profits as they run. Dr. Alex Elder would wait until the stock pulled back into his 'value' area, whereas another trader might start a position right now. It is important to define your style but this trade must be managed rather than a long term hold. Protection of capital is important.
There is obviously a huge interest in this stock and the technology they represent. The stock doubled in one month on the IPO. How you trade this accumulation base is important, but it has all the typical patterns of how IPO stocks start, pullback and then go on a big run. Facebook would be another example of how an IPO stocks bases and then breaks out. Here it is below. What you do not know at this point is where you are in a basing model.
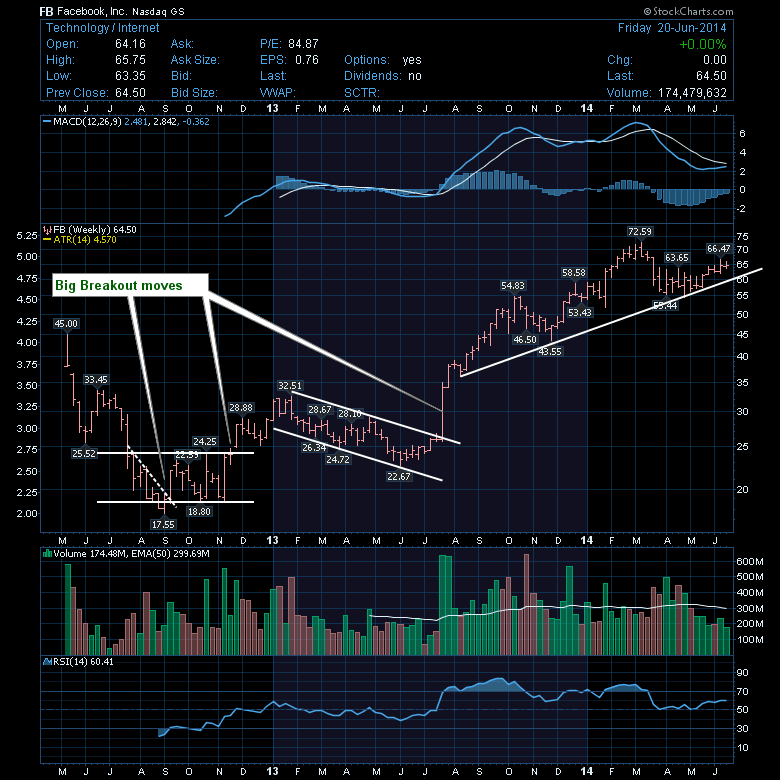
In two of three cases after the trend line breaks in Facebook, the stock pulled back below the halfway mark on the breakout candle. Gaining an understanding of where you are in a base is critical.
Using a Wyckoff model or developing your own methodology for identifying critical IPO breakouts will help make you more successful. How you manage the trade based on certain levels of support and resistance is equally important. Because it is a phase one trial result, I would not expect this base to be the final test of this level. There are too many unknowns. I could easily be wrong in my assumption, but if I assume the stock will retest this base in the coming months, it gives me a reason to wait for entry rather than chasing a 25% move with no underlying financial performance in the company.
All that to say, I would not chase the stock here. I would wait for a retest of the $14 to $15 level and set an alarm.
To set the alarm, look on your member page. You can see, I have underlined the "Technical Alert Workbench".
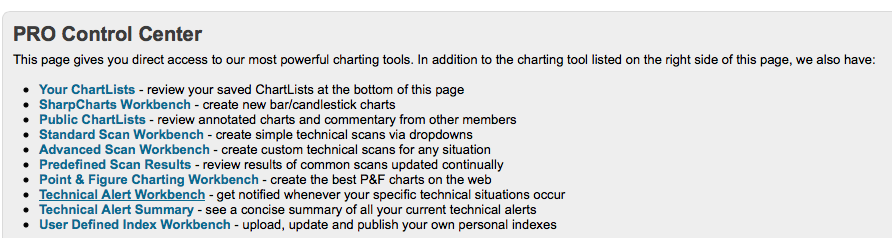
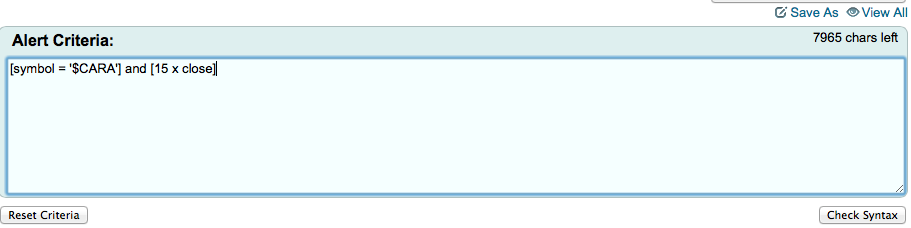
Then you can enter a simple string of information. "x" represents "crosses above". So if we write [close x 15], it is the same as writing [close crosses above 15].
However, we want to be told when the close settles back below $15, so we want [15 crosses above close] or [15 x close]. After you have set your criteria, you must hit "Save As' in the top right of the box below and give a meaningful name to the Alert. If it takes two months, you will be left wondering why this alarm is going off.
You may have a different method of attack. That is what makes a market. Once this pulls back to $15, I will re-evaluate, not necessarily enter just because it is below $15.
The stock looks promising, but to me it looks like very early days in the drug approval process. I would suggest the froth will come off the stock while the patients are in the trial, but no answers are known. We'll see if I get to enter this at a lower level. If not, it looks like I'll let this one pass rather than entering today on a 25% surge in 2 days.
If you liked this article, feel free to forward it to investing friends and family. If you didn't like the blog, please send me a note on what I could do better. The chart is printable. It should also be clickable and you can modify the settings if you want to print a with a white background.
We try to keep our articles informative and entertaining. Make sure you check out the other blog writer articles in Mailbag, Chartwatchers, Traders Journal, DecisionPoint, Don't Ignore This Chart, Chip Anderson, Scanning Technically, and The Canadian Technician. For example, Chip Anderson's most recent article explains how to get the alerts mentioned in this article above to come as texts now rather than just as email.(Too Sweet!) StockCharts subscribers have exclusive access to timely blog articles called the Market Message, Arts Charts and Market Roundup by Arthur Hill, John Murphy, Greg Schnell and Martin Pring as well as the DecisionPoint Tracker and DecisionPoint Reports. Are you paying $/month for newsletters elsewhere and overlooking the subscriber value of StockCharts blogs? These writers put a lot of effort in to share timely information. You can subscribe for email or RSS updates when new articles are posted in the top right of every blog. You may have also noticed our Top Advisors Corner where other technicians share their thoughts.
Lastly, Chartcon 2014 in Seattle is rapidly booking up. My understanding is the hotel is close to 'Sold Out' and there are a few spots left for what is sure to be one of the best hands on, low-cost-conferences in Technical Analysis. Have you ever tried to line up John Murphy, Martin Pring, Alexander Elder and Richard Arms who are all prolific authors on Technical Analysis in one place? Click here for more information on Chartcon 2014. It is an unbelievable lineup of 12 speakers! Bring your laptop so you can follow along with the annotations and other advanced parts of the website. If you are new to the website or want an update on all the tools available, the opportunity doesn't get better than this. For individual investors or portfolio managers, this will be a highlight of the year for building your charting skills, chart management and storage as well as investing methodologies. Click through here for more information on Chartcon 2014. Its only 45 days away!
Good trading,
Greg Schnell, CMT


