Now that we have a weekly and daily template set up, I'll just roll through a few more solar stocks today. If this is the first article on solar stocks that you are reading, you may wish to go read Part 1, Part 2 and Part 3 from earlier this week.
Next on the list is TAN, a solar stock ETF. This ETF is specific to solar where the other ETF (KWT) was for renewables in general.
1) The SPURS are declining so that is not good. Notice the nice uptrend in 2013.
2) The SCTR is one of the worst ETF's for performance currently. We could set an alert for the 30 level as an example just to let us know it's starting to improve.
3) The price is pulling back after soaring 450% in 2013. It has pulled back about 30% off its highs, most of that since September 2014. The Big Blue top line is the main ceiling for the ETF. Because this ETF directly tracks Solar only, this is a great industry indicator. A break above $40 would take out both the trading range for the last 3 months and the 40 WMA. The breakout above the Big Blue main trend line would be at $44 and the 52 week high is at $51.07. The nine month high would use $46.30 which is also above the big blue trend line so that might be enough for most. Figure out where you would like to enter.
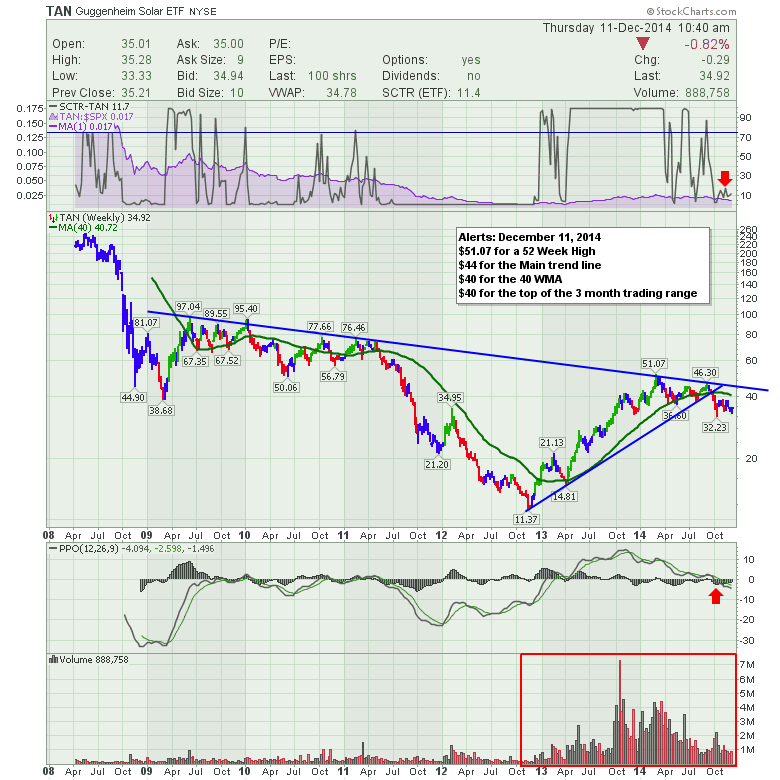
4) The PPO is just below zero.
5) The volume is excellent on this ETF. It has been around 1 million a week or 200,000 a day. So compared to KWT, this is much better. We can also see late in the 2013 year that 2 Million was regularly attainable.
So this looks like an excellent barometer for the industry group. Now we'll zoom in on the daily. On the daily, the SPURS is in a tight downtrend and continues to drift lower. The SCTR ranking has been sideways for 3 months. The price action is consolidating and trying to hold $32. By zooming in on the daily we can see the trading range between $32 and $38 rather than $40. However, all of that is below the 200 DMA. It is pretty important that the $32 level holds. It also looks like $38 will be resistance.
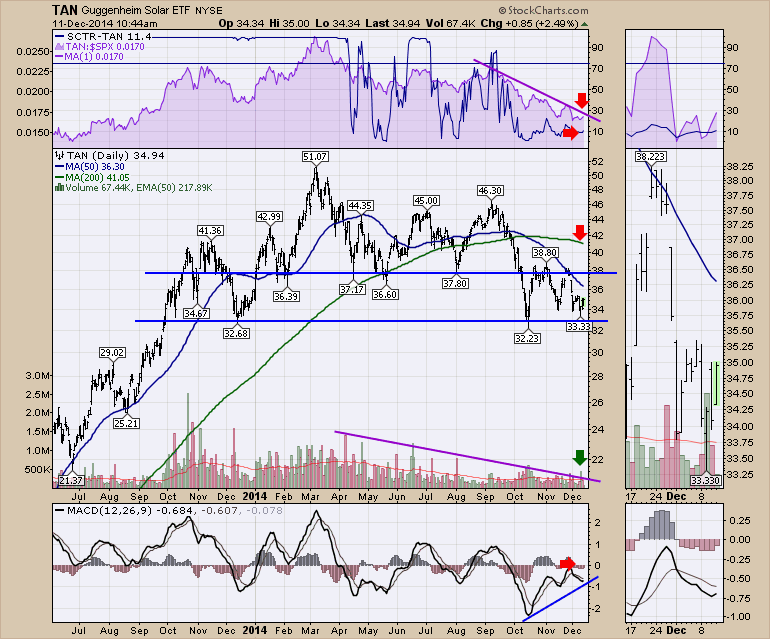
The Volume has been trending down but we had the highest up day volume in 2 months on Tuesday. The October low also had the highest volume candle in a while. A 600 K up day would suggest a major change in the volume trend. Lastly the MACD is trying to make a higher low here even though the price is at the same low as October. That would be positive divergence IF the MACD gets a positive cross.
Moving on to Sunpower (SPWR), we come to one of the oldest solar stocks in the public market. It started trading in the fall of 2005 and the chart couldn't be more interesting than it is right now. After IPO'ing around $25, doubling and pulling back below the IPO price, it rocked up to $164. From there it crashed in the Financial Crisis and hovered around $18-21 which was a lower low. It proceeded to work its way down to $3.71 which is pretty much a 98% drop. Then it soared 1200% and has now dropped by about 50%. That would pretty much describe the problem with buy and hold investing.
1) The SPURS are declining.
2) This company just got added to the SCTR listings and is currently in the bottom 10%.
3) The price action has pulled back about 50% since going on a 1200% run. It is close to support at the $22 level.
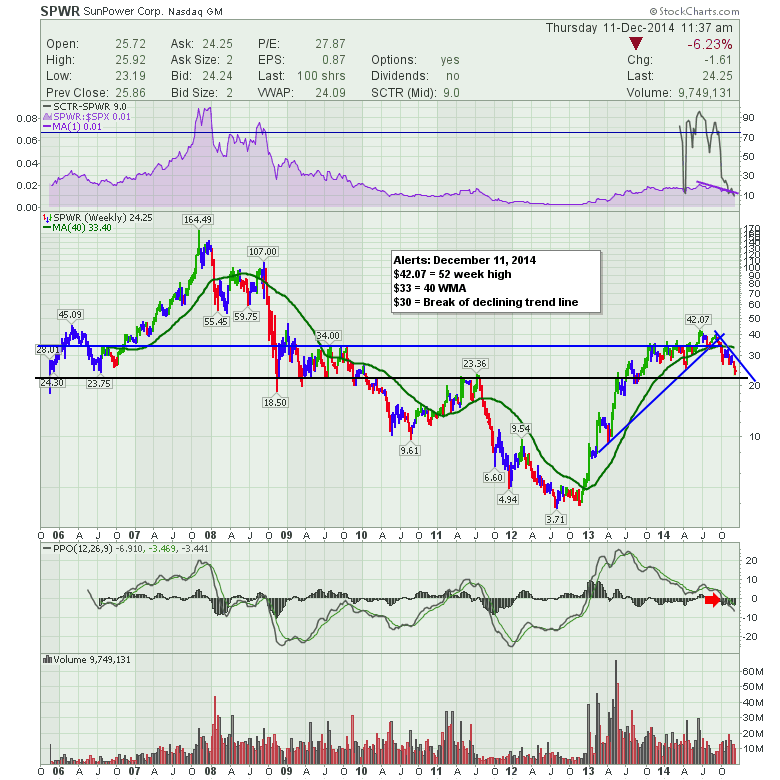
4) The PPO is below zero and pointed down.
5) Lots of volume with 10 million shares a week.
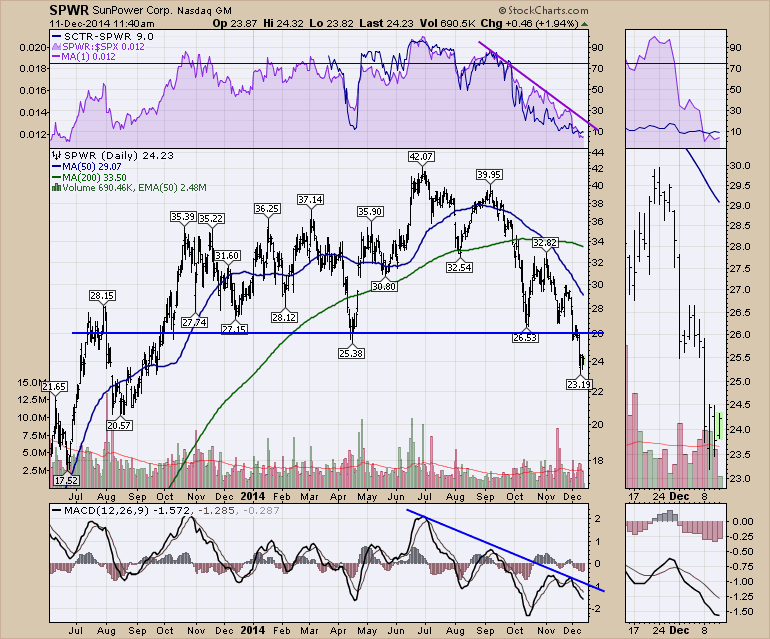
Here is Sunpower's daily chart. Everything is still declining and Sunpower lost support at the $26 level. The daily volume is big with a 50 EMA at 2.5 million/day. The only real hope for any trend change at this point might be a higher MACD low which would suggest the selling momentum is ending.
Canadian Solar is next (CSIQ).
1) The SPURS is declining but has not broken down like most of the charts we have seen. Any further underperformance would be new 52 week lows for the SPURS.
2) There is no SCTR ranking for this one.
3) We can see CSIQ was very close to breaking out to new all time highs this year when it rolled over. This is one of the strongest solar stocks which is close to the highs of 2008. We can see it is consolidating in the last year but the range is wide. $21 to $44. After climbing 2200% from the 2012 lows, the stock has pulled back more than 50% and is testing the recent lows of $21.38. Definitely a strong stock consolidating.
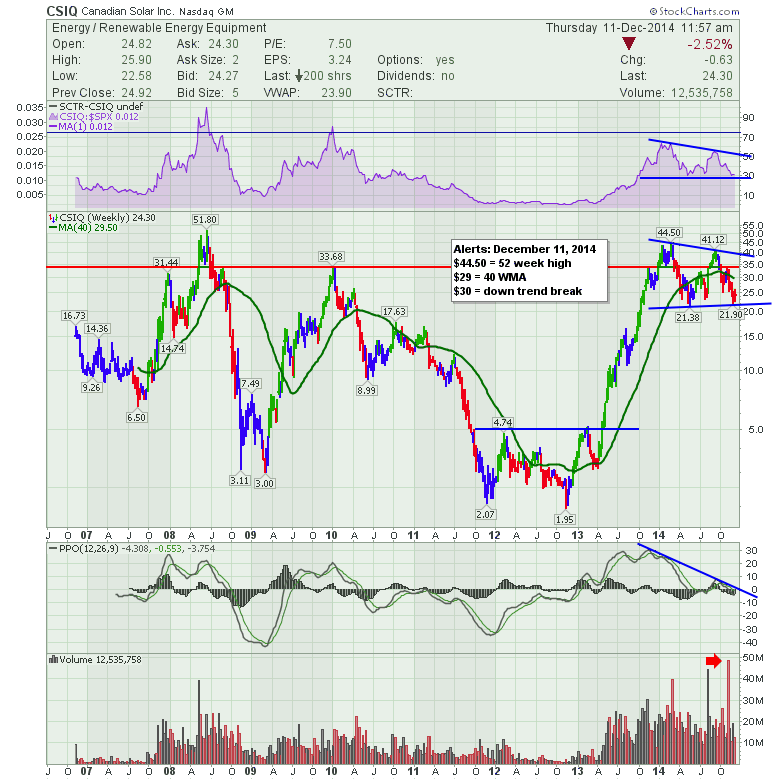
4) The PPO is right around zero. A bounce from here would be very bullish.
5) Massive volume interest over the last 2 years. The stock regularly does between 10 and 20 Million per week. In November we had a big volume week near 50 Million. Investors interested in solar are showing up for work here.
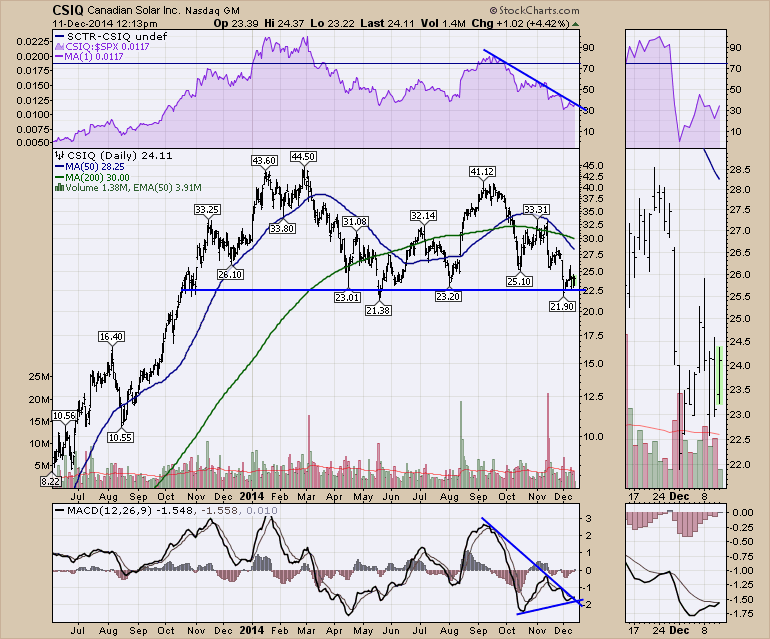
Let's slide into the daily chart. The SPURS have been declining in a consistent down trend. A break in this trend would be an important signal. I have drawn horizontal support around $22.50. This is an important level for CSIQ to hold. The big volume bars are almost 3 months apart so that is earnings volatility. You can see in the zoom panel that the MACD is close to crossing and making a higher low even though the price has made a lower low than the October low.
I am going to leave it there for today. I would encourage you to listen in on the webinar this afternoon if you have time. We start at 4:30 EST and try to wrap up in exactly one hour. Friday, I'll continue to work on the solar stocks. Martin Pring published an important article yesterday on the big picture. If you get a chance, I would encourage you to read through it on the Market Roundup for subscribers. Arthur Hill also published a webinar this week. You can find the link to the video on the What's New section of the home page.
If you liked this article, feel free to forward it to investing friends and family. If you didn't like the blog, please send me a note on what I could do better. The chart is printable. It should also be clickable so that you can go look at the settings.
We try to keep our articles informative and entertaining. Make sure you check out the other blog writer articles in Mailbag, Chartwatchers, Traders Journal, DecisonPoint, Don't Ignore This Chart, Chip Anderson, Scanning Technically, and The Canadian Technician. Subscribers have access to blog articles by Arthur Hill, John Murphy, and Martin Pring as well as the DecisionPoint Tracker and DecisonPoint Reports. Don't forget to look for the subscribe button for RSS feeds and email.
On the Blogs tab, you can also see the Top Advisors Corner in the right hand panel where other technicians post their work. If you are paying for newsletters all over the Internet, don't miss all the articles here that are included!
For attending the next “Canadian Technician” Webinar, please click here to register.
Good trading,
Greg Schnell, CMT


