ChartWatchers October 19, 2008 at 10:05 PM
Warren Buffett said he was buying stocks this past week. Should you? Well, it depends. If you buy stocks on a regular basis as part of a disciplined strategy - say in your 401(k) plan - then keep buying... Read More
ChartWatchers October 19, 2008 at 10:04 PM
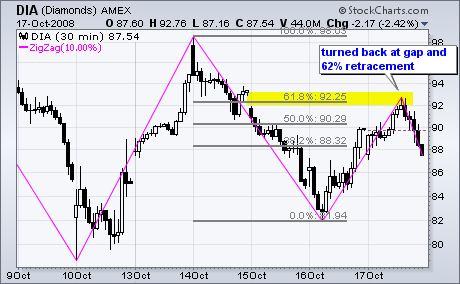
In a volatile week with huge swings, the Dow Industrials ETF (DIA) returned to Wednesday's gap with another 10% move. The magenta lines on the 30-minute chart show the zigzag indicator, which measures movements that are 10% or more... Read More
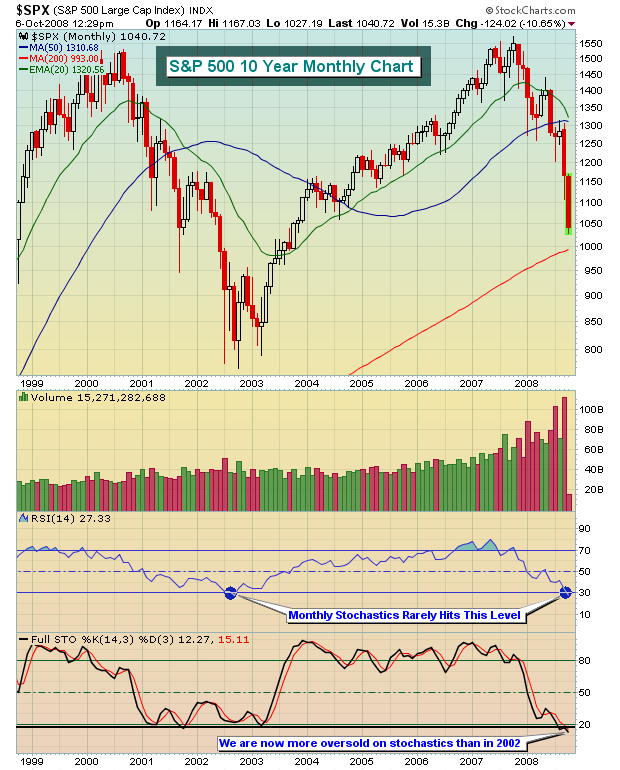
ChartWatchers October 19, 2008 at 10:03 PM
To say that the market is very oversold is not exactly breaking news because it has been oversold for at least a few weeks; however, the oversold condition has been steadily getting worse over that time, and we have perhaps reached the limit of how oversold the indicators will ge... Read More
ChartWatchers October 19, 2008 at 10:02 PM
Quite simply, the trend is sharply lower... Read More
ChartWatchers October 19, 2008 at 10:01 PM
A number of readers have asked if I thought the U.S. was in a recession or heading into one. Others have asked if I thought this recession would be worse than most... Read More
ChartWatchers October 19, 2008 at 10:00 PM
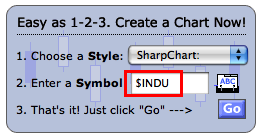
Hello Fellow ChartWatchers, Recently we've gotten several questions about how someone can display more than one stock on a single chart. I thought I'd take time this week to go over the steps you can take to do that with our SharpCharts Workbench. Let's get started... Read More
ChartWatchers October 05, 2008 at 10:05 PM
Two weeks ago, I said to buy the bottom. Sometimes, you're just wrong. I was wrong. Technical analysis is to the study of price action to increase the odds of predicting future price action... Read More
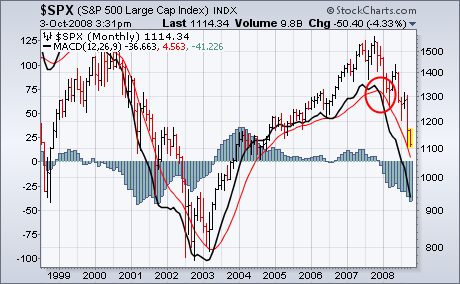
ChartWatchers October 05, 2008 at 10:04 PM
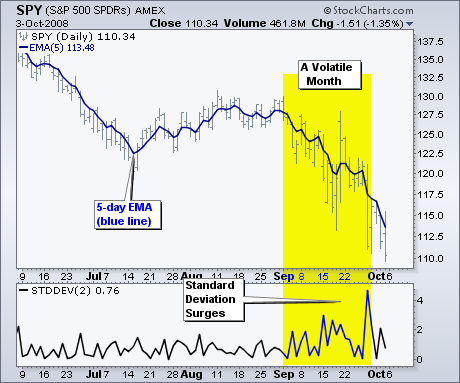
September was one of the most volatile months in recent memory. Bar charts and candlestick charts are great, but the wild high-low swings can interfere with basic trend analysis. Moving averages provide a good means to smooth this volatility by cutting through the daily noise... Read More
ChartWatchers October 05, 2008 at 10:03 PM
In my September 19 article I said: "Our indicators and price action suggest strongly that we are beginning a rally that should last at least a couple of weeks. I also think that this week's deep low needs to be retested, and I am not convinced that a retest will be successful... Read More
ChartWatchers October 05, 2008 at 10:02 PM
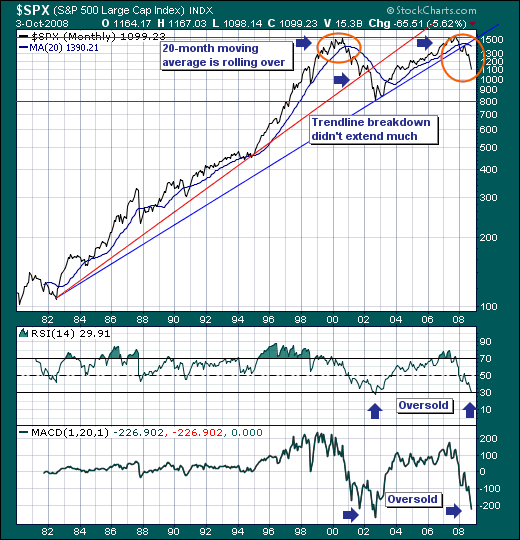
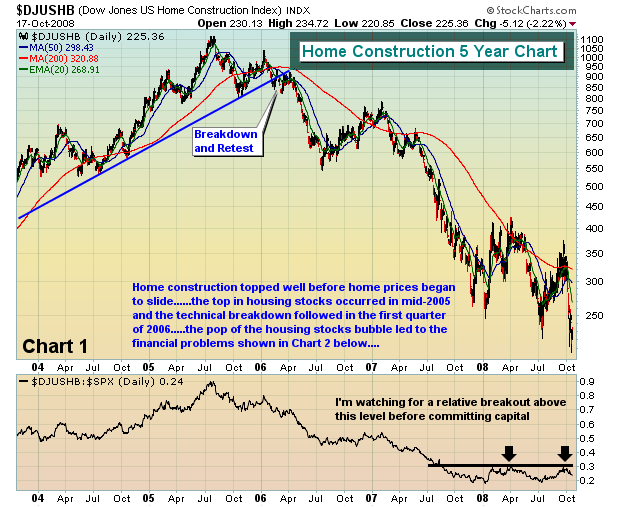
The bear market reasserted itself last week in a violent manner; trading sharply higher and lower in a matter of hours and days. This isn't your garden variety bear market as this one smells and feels much different given the enormity of the credit crisis... Read More
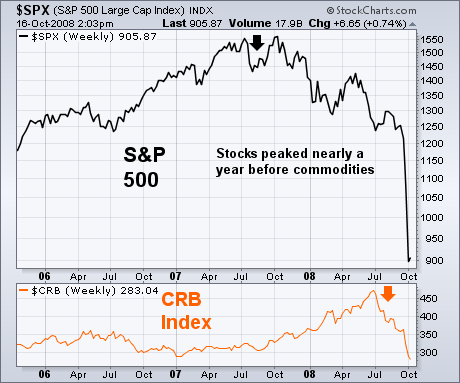
ChartWatchers October 05, 2008 at 10:01 PM
Over the past couple of weeks, I've suggested taking no new action in the stock market. Part of my reasoning is that we've been recommending a bearish strategy for the past year and see no reason to change that... Read More
ChartWatchers October 05, 2008 at 10:00 PM
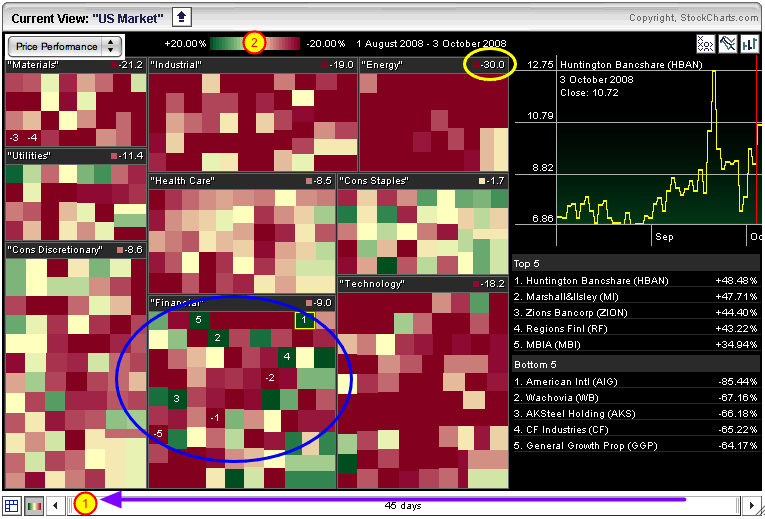
With all the changes happening in the financial world right now it's gotten really hard to keep up with the latest news. This bank is failing. That company is merging with this one. That sector is over exposed to the credit crunch. Etc., etc., etc... Read More