ChartWatchers December 20, 2015 at 11:49 AM
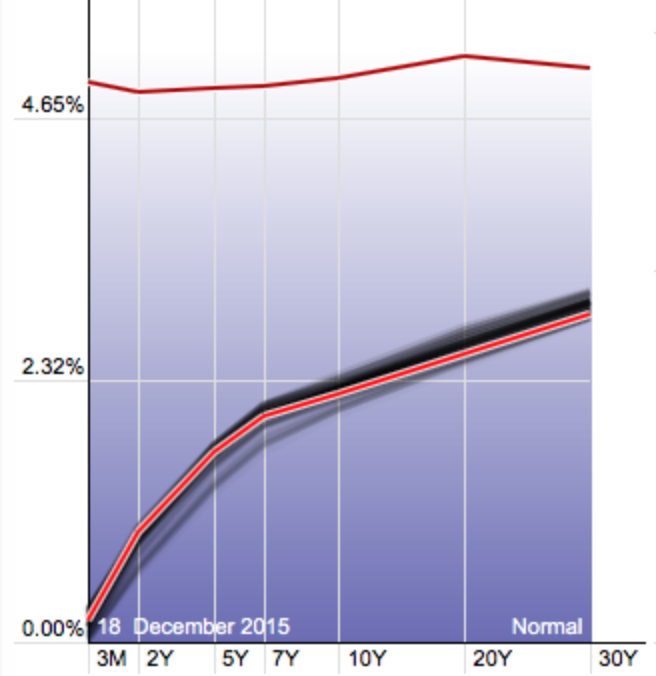
Hello Fellow ChartWatchers! Welcome back to reality - just in time for Christmas! Reality is a place where interest rates are not stuck at zero. It's a place where the yield curve actually moves from time-to-time... Read More
ChartWatchers December 20, 2015 at 10:28 AM
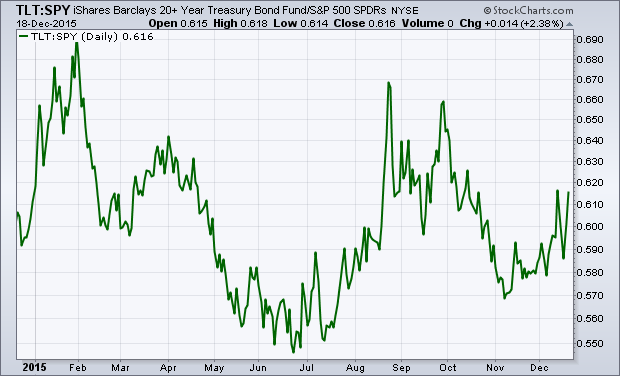
Last Saturday's message showed that Treasury bonds have been doing better than stocks since the summer. That's still the case. This chart below shows a ratio of the the long-dated Treasury ETF (TLT) divided by the S&P 500 SPDRs (SPY)... Read More
ChartWatchers December 19, 2015 at 01:26 PM
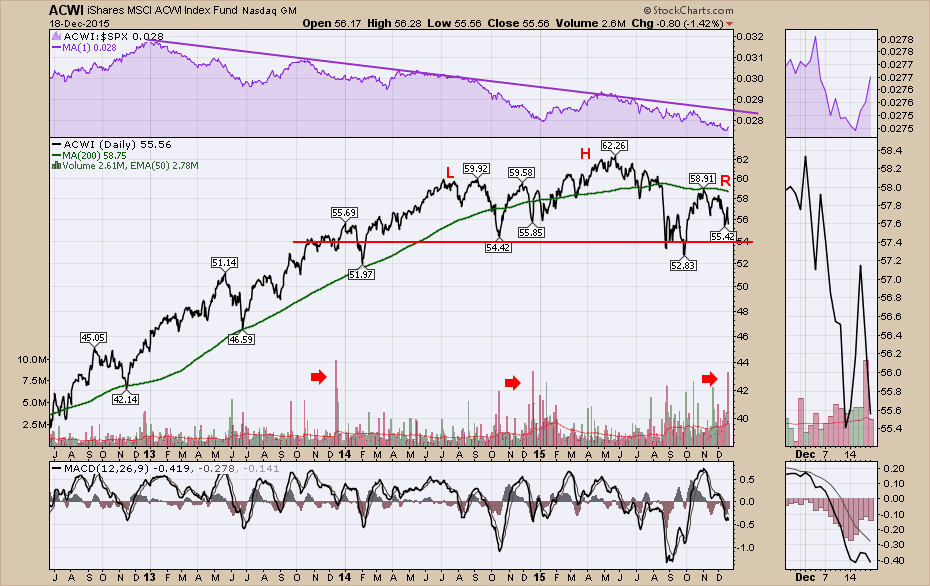
The markets have been rolling over worldwide in 2015. The big picture worldwide is a massive topping structure as shown by the MSCI All World Index (ACWI). This index has a 53% weighting towards the USA and 9 of the top 10 are American companies... Read More
ChartWatchers December 19, 2015 at 12:04 PM
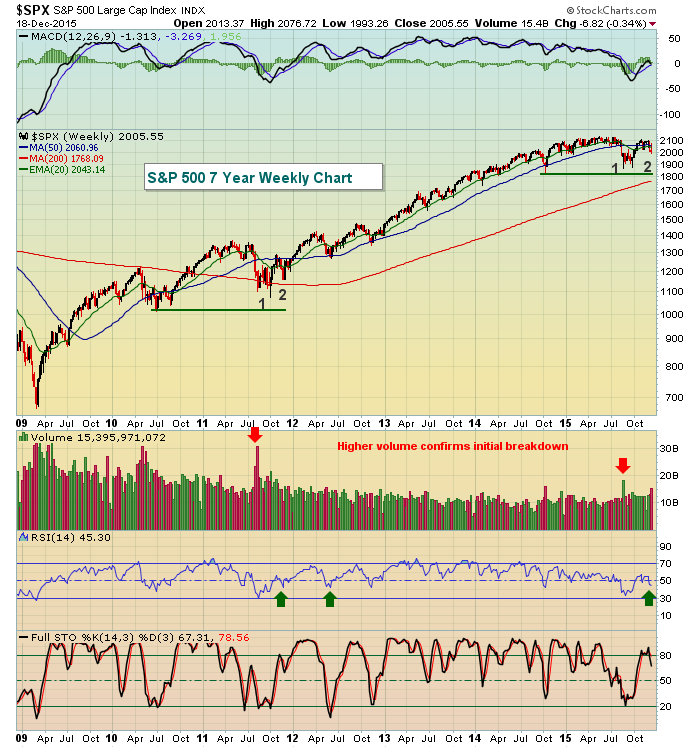
I'm not ready to write off this bull market as the most important indication of all - the combination of price/volume - remains bullish in my view. But the signals "under the surface" are beginning to erode. One of two things will likely happen... Read More
ChartWatchers December 19, 2015 at 03:36 AM
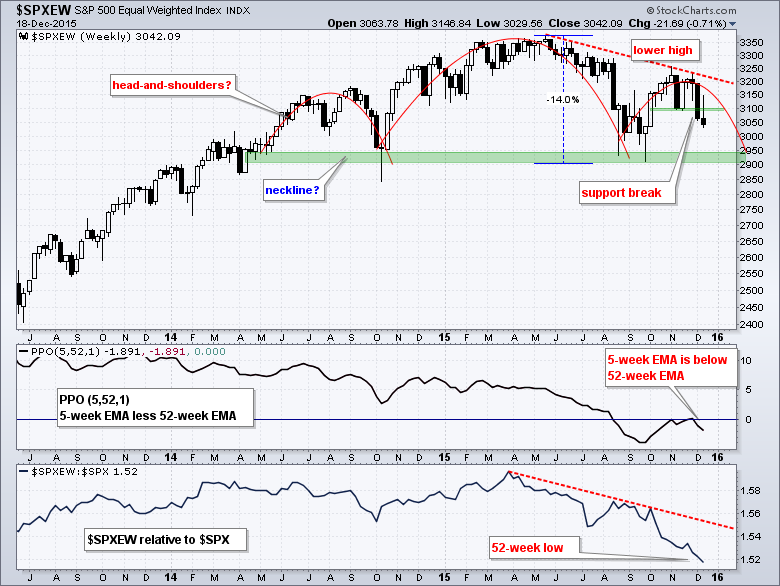
The S&P 500 Equal-Weight Index ($SPXEW) continues to underperform the market-cap weighted S&P 500 and its downtrend resumed with a break down in mid November... Read More
ChartWatchers December 18, 2015 at 11:08 PM
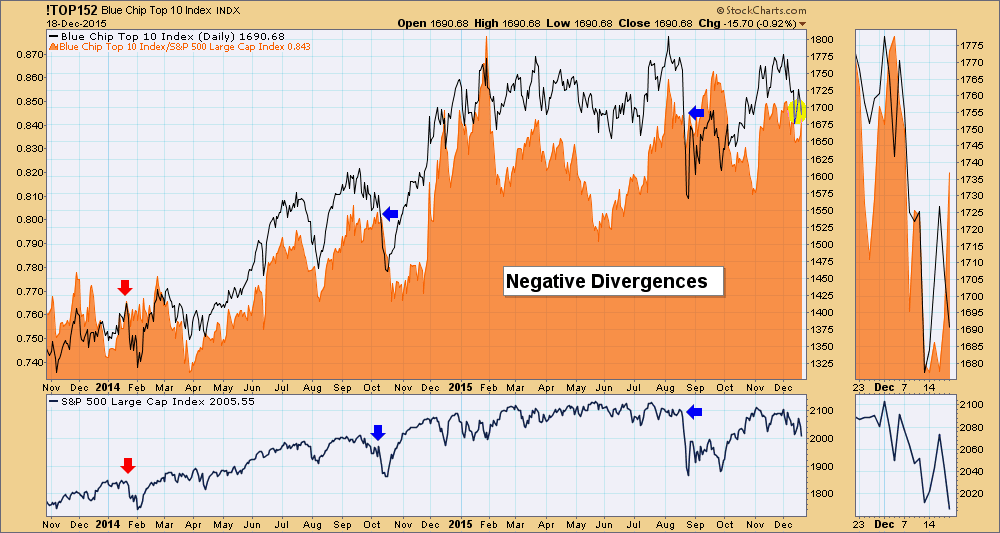
In the late-1990s Carl developed the Blue Chip Top 10 Index (!TOP152), which tracked the top ten ranked stocks (by PMO value) from our Blue Chip list of 152 stocks that DecisionPoint covers in its reports in the DecisionPoint Reports blog... Read More
ChartWatchers December 06, 2015 at 01:18 AM

Hello Fellow ChartWatchers! Well, it's that time of year again - time to save a bunch of money on your StockCharts membership! As long-time members know, we usually run our Holiday special during the month of December and that is usually a great time to take advantage of the end-... Read More
ChartWatchers December 05, 2015 at 08:41 PM
Wow, this market has been one for the Almanac. This week I read a commentary from a top technician saying the bull market is still intact. It was only 4 months ago that Dow Theory triggered a sell signal... Read More
ChartWatchers December 05, 2015 at 06:55 PM
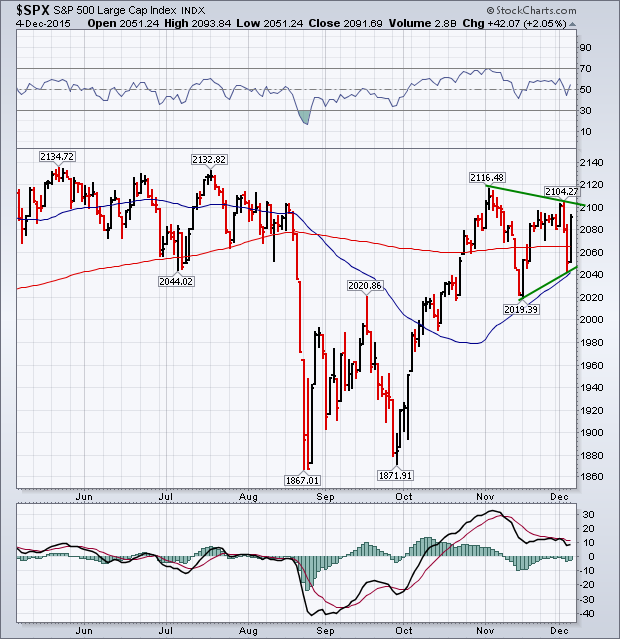
A strong rally on Friday more than erased losses from Thursday and left the market in much better shape. The chart below shows the S&P 500 ending the week back above its 200-day average after bouncing off its 50-day line on Thursday... Read More
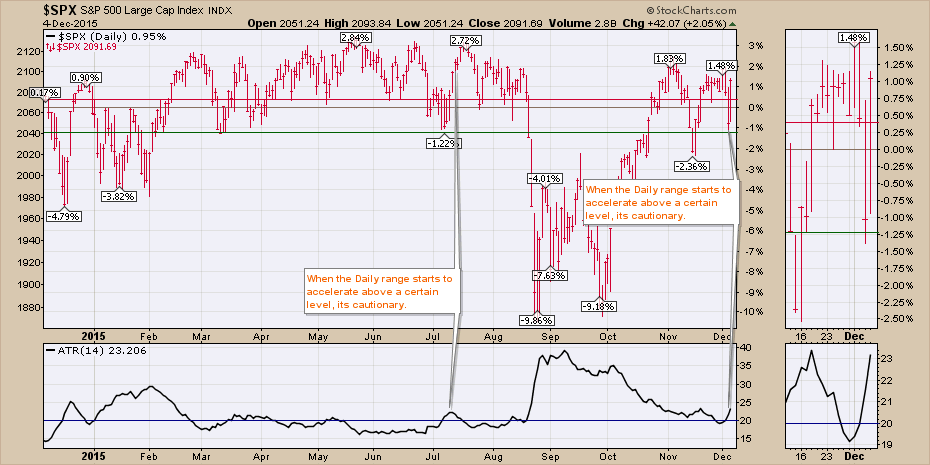
ChartWatchers December 05, 2015 at 06:51 PM
On 12-3-14 the S&P closed at 2074. On 12-3-15 (Friday) the S&P closed at 2091. That's about as flat as you can get over a 12 month period and it helps explain why many traders have had a difficult time scoring big gains over the past year... Read More
ChartWatchers December 05, 2015 at 02:24 PM
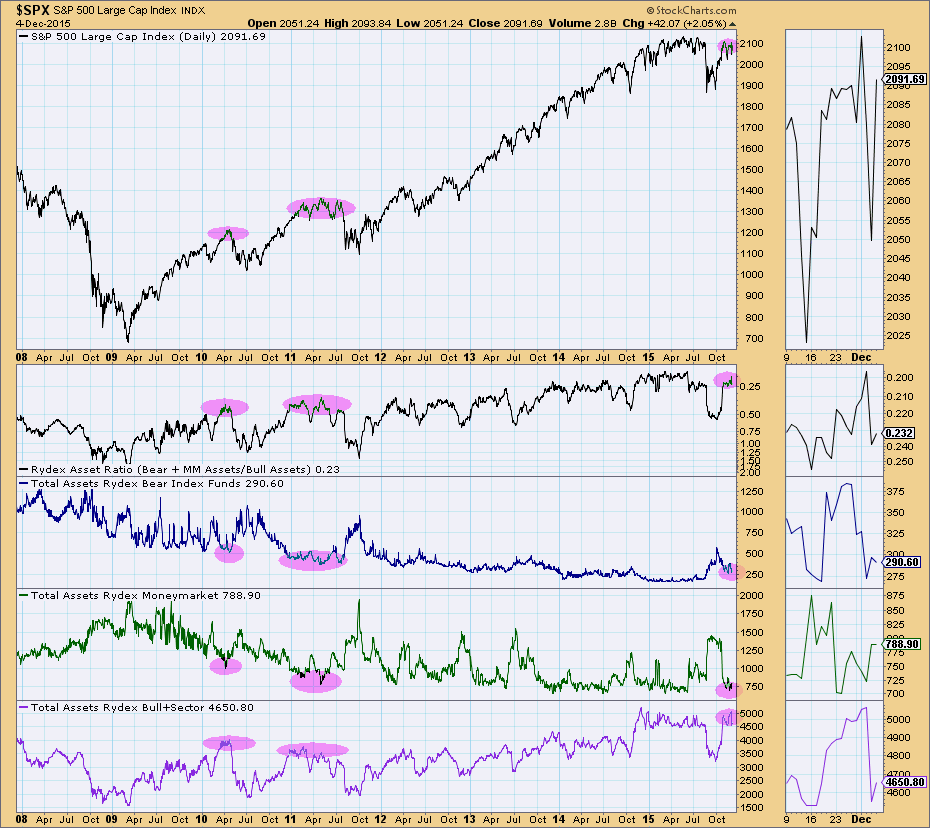
After the tug-o-war of the last two trading days, I decided it was time to look at sentiment based on the DecisionPoint Rydex Assets Analysis charts. There are two to look at and they are both available in the free DecisionPoint Rydex Funds ChartPack... Read More
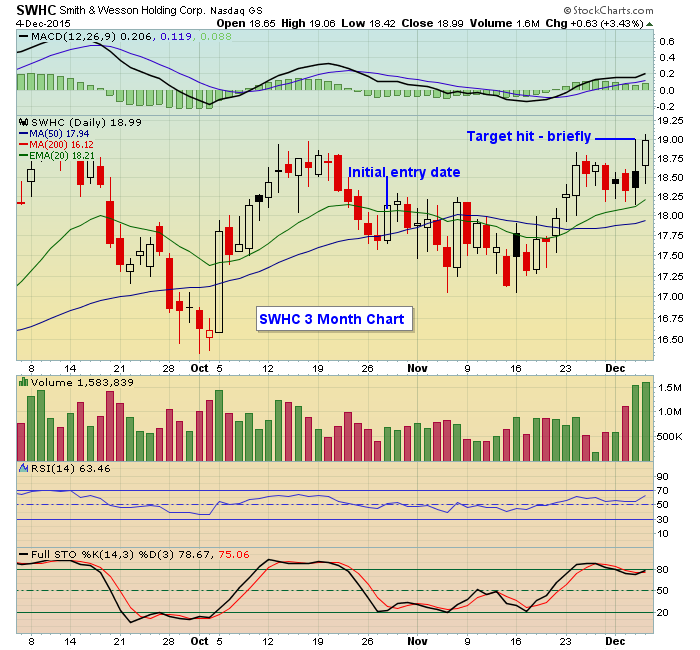
ChartWatchers December 05, 2015 at 11:55 AM
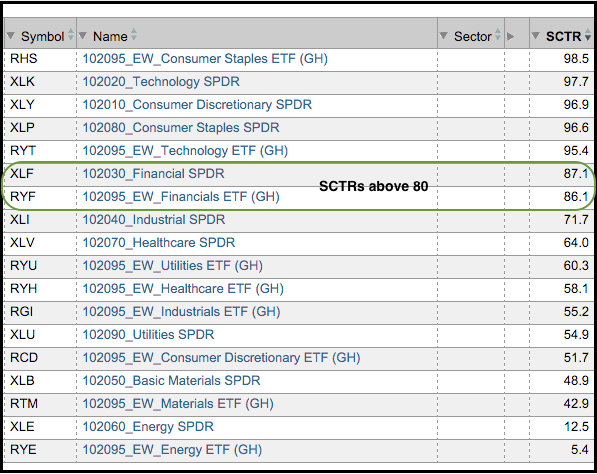
The finance sector is one of the stronger sectors right now and this is positive for the overall market... Read More
ChartWatchers December 05, 2015 at 11:29 AM
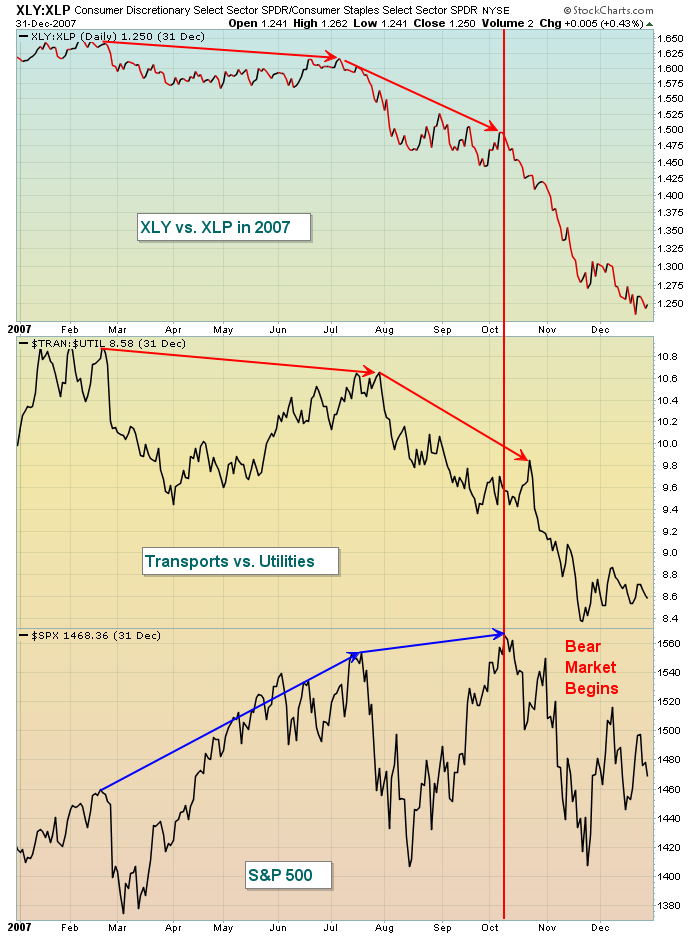
The start of every bear market is different. Sometimes it's driven by technology stocks, other times it's a financial crisis. Whatever the case, one common denominator seems to be that aggressive areas of the stock market are abandoned as final tops are made or challenged... Read More