ChartWatchers March 19, 2016 at 05:40 PM
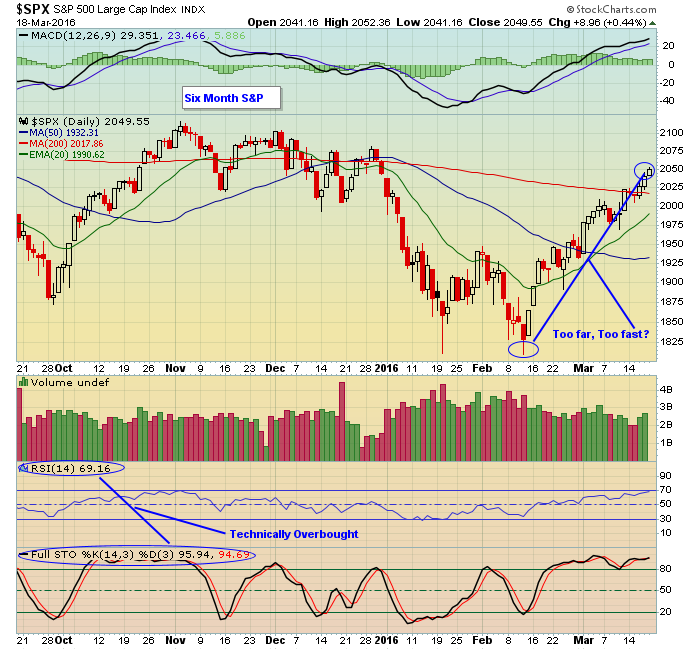
The market has been pretty much straight up since the February 11 bottom of 1810. Since that day the S&P has climbed 13%. That's a very impressive move by any measurement. In fact, I would argue that it has been too much too quick... Read More
ChartWatchers March 19, 2016 at 05:37 PM
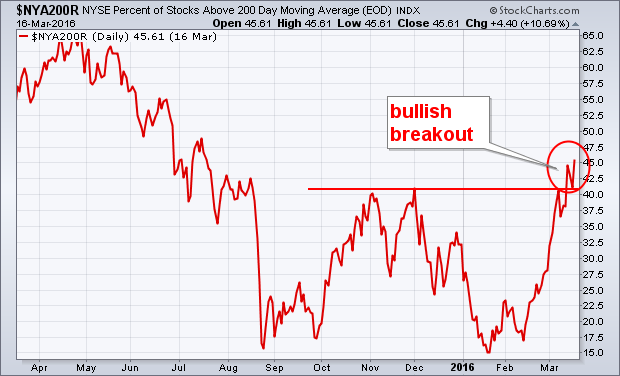
NYSE PERCENT OF STOCKS ABOVE 200-DAY MOVING AVERAGE TURNS UP..... Read More
ChartWatchers March 19, 2016 at 05:00 PM
Industry breadth is usually helpful in finding a new breakout trend. What we mean by that is the number of stocks within an industry group that are breaking out together... Read More
ChartWatchers March 19, 2016 at 03:06 PM
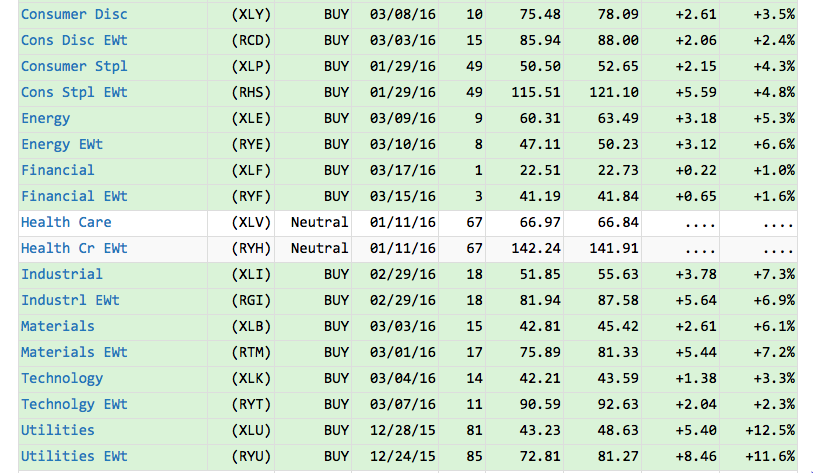
All of the sectors on the DecisionPoint Market Sector Summary are green with Intermediate-Term Trend Model BUY signals...except for Healthcare. As you can see from the excerpt of the report below, the current Neutral signal has been in effect for over two months... Read More
ChartWatchers March 19, 2016 at 02:33 PM
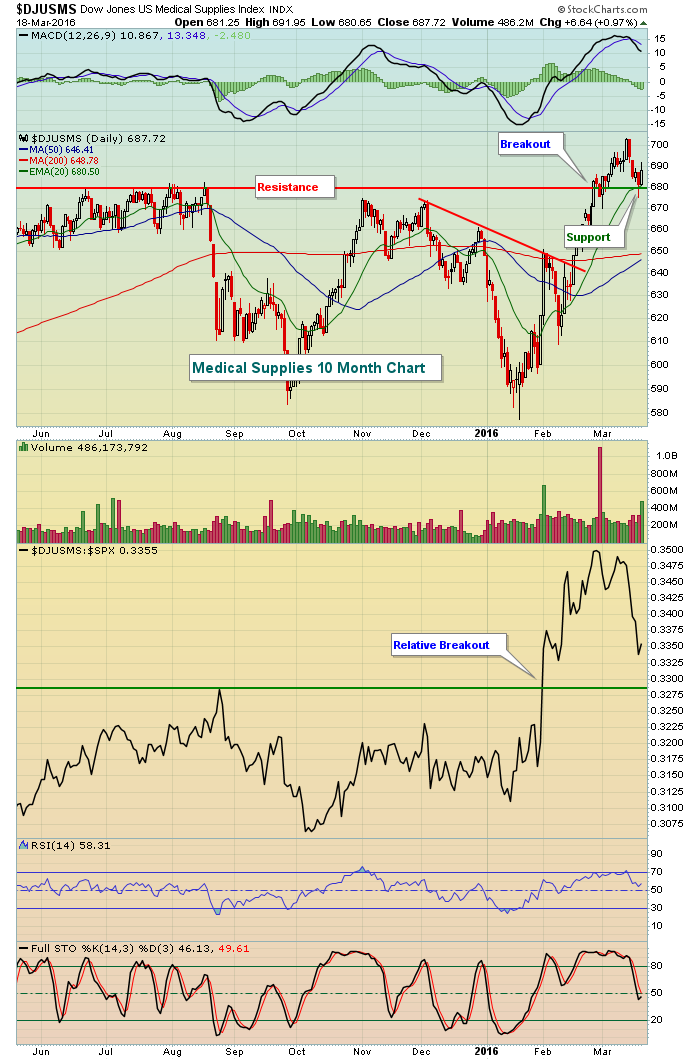
Healthcare (XLV) has been the weakest sector over the past one and three month periods, but you'd never know it from looking at the Dow Jones U.S. Medical Supplies Index ($DJUSMS). The DJUSMS has gained over 8% during the past three months while the Dow Jones U.S... Read More
ChartWatchers March 19, 2016 at 11:42 AM
Hello Fellow ChartWatchers! Well, I don't know about you, but I'm impressed. Last week, the current rally moved higher and gained more momentum... Read More
ChartWatchers March 19, 2016 at 05:54 AM
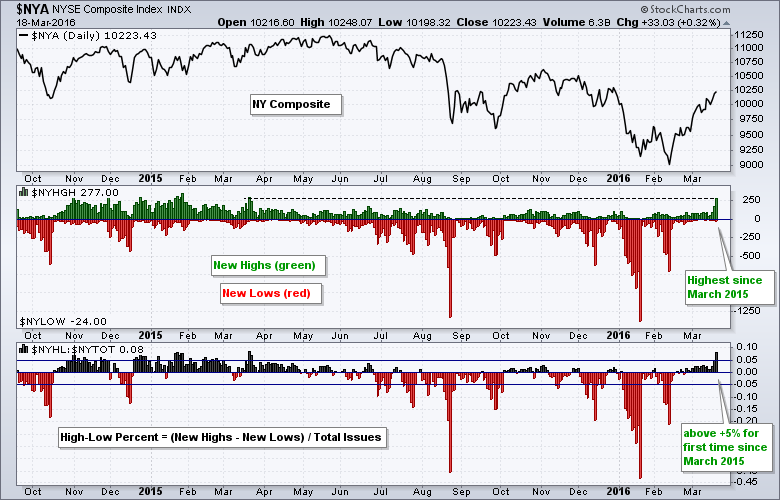
Two weeks ago I featured the NYSE McClellan Oscillator ($NYMO) and the Nasdaq McClellan Oscillator ($NAMO) as they surged to their highest levels in years. These breadth indicators are very broad and represent virtually all stocks traded in the US... Read More
ChartWatchers March 05, 2016 at 10:50 PM
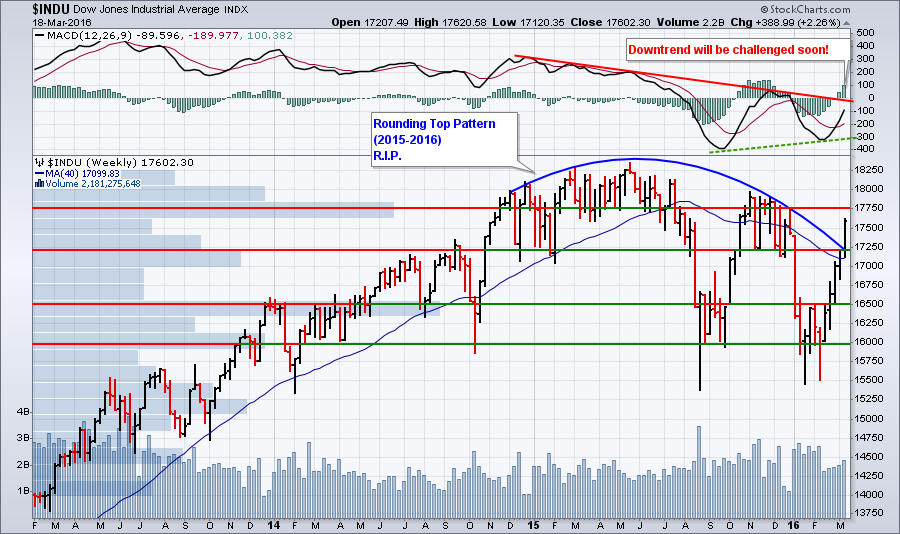
Hello Fellow ChartWatchers! After an unexpectedly quick rise in stock prices this week, the markets are poised for a showdown. It's too bad we can't have the stock market be more like an athletic event..... Read More
ChartWatchers March 05, 2016 at 10:36 PM
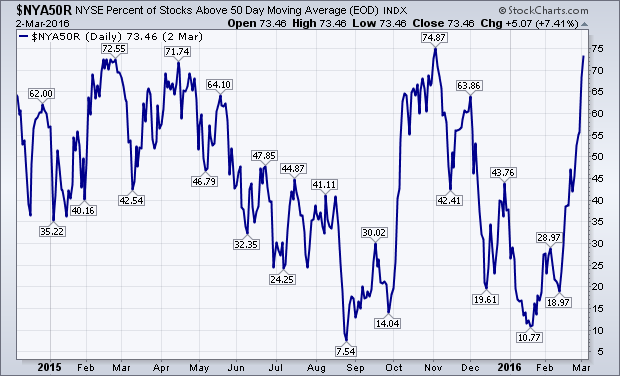
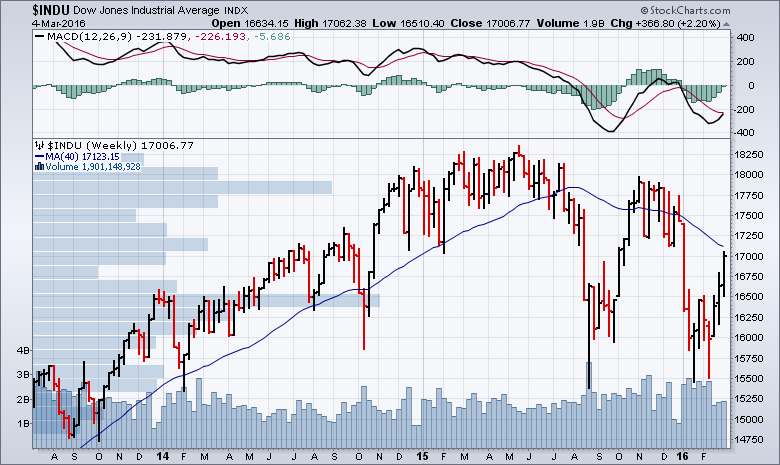
A lot of attention is now being paid to stocks testing or exceeding their moving average lines. My February 20 message had a headline suggesting that the percent of NYSE stocks trading above their 50- and 200-day moving averages might be bottoming. Let's take another look... Read More
ChartWatchers March 05, 2016 at 10:27 PM
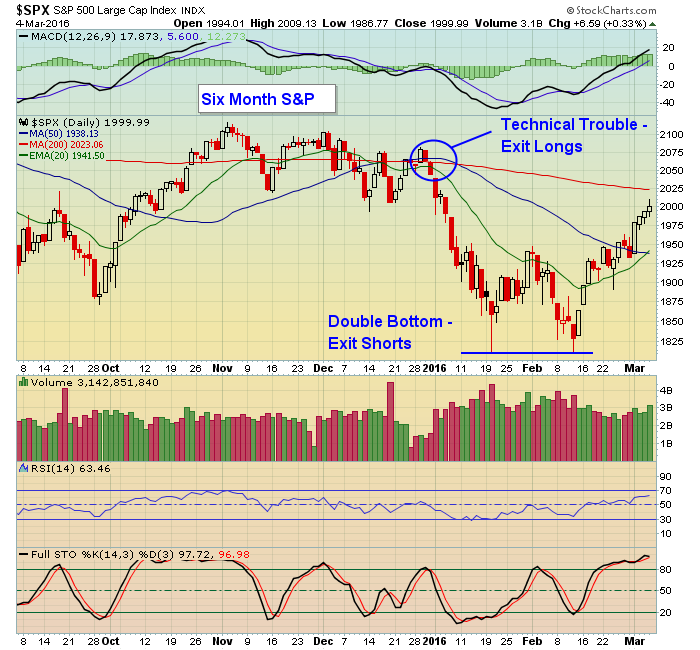
If the market this year has taught us one thing it's that it's as easy losing money when the market is going up as when it is going down. Consider this. After the first trading day of the year was over, the S&P closed at 2012... Read More
ChartWatchers March 05, 2016 at 02:13 PM
Yes. Does that mean the stock market is guaranteed to roll over and play dead? Absolutely not. Trading success is not always dependent on being right, as crazy as that might sound. It's about planning your trades to minimize risk in the event your call is incorrect... Read More
ChartWatchers March 05, 2016 at 01:24 PM
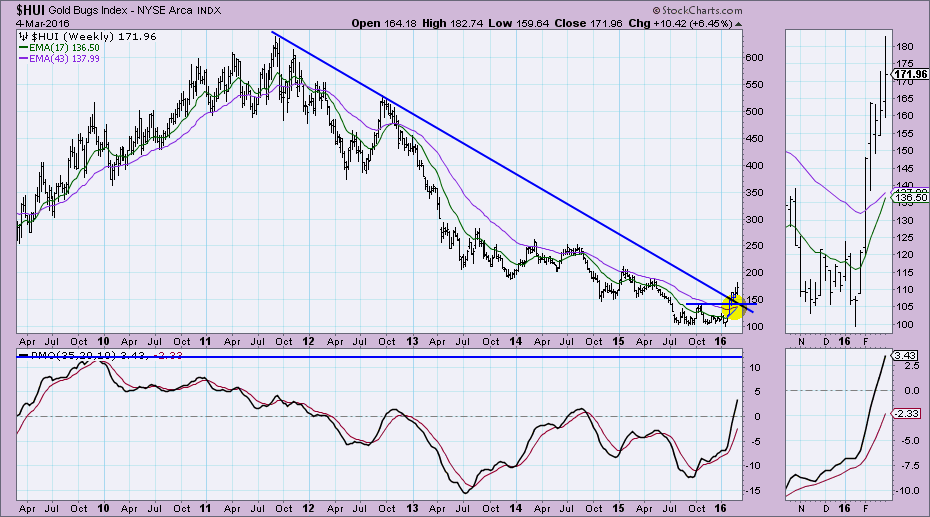
I don't want to steal Carl's thunder as I happen to know he will be writing a follow-up article to his previous article on Gold. However, I did receive an email question to look at possible support levels on the Gold Bugs Index ($HUI)... Read More
ChartWatchers March 05, 2016 at 06:05 AM
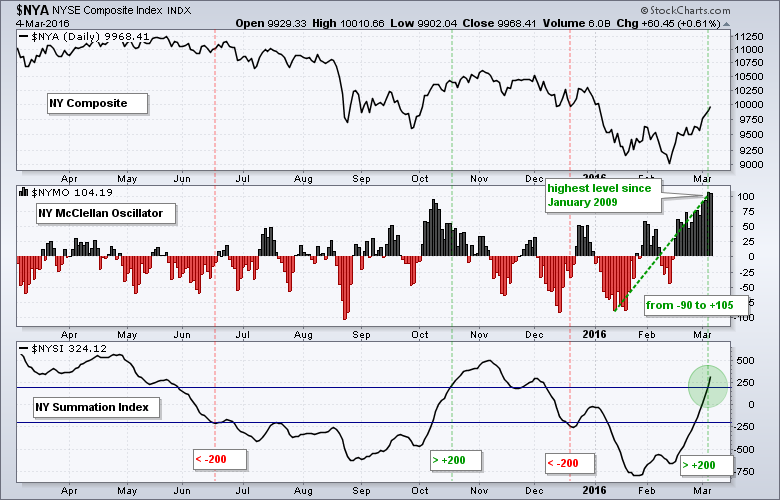
The McClellan Oscillators for the NYSE and Nasdaq surged over the last few weeks and hit multi-year highs. Medium-term, I would consider this breadth surge bullish. Short-term, however, it creates an overbought condition that could lead to a pullback or consolidation in stocks... Read More
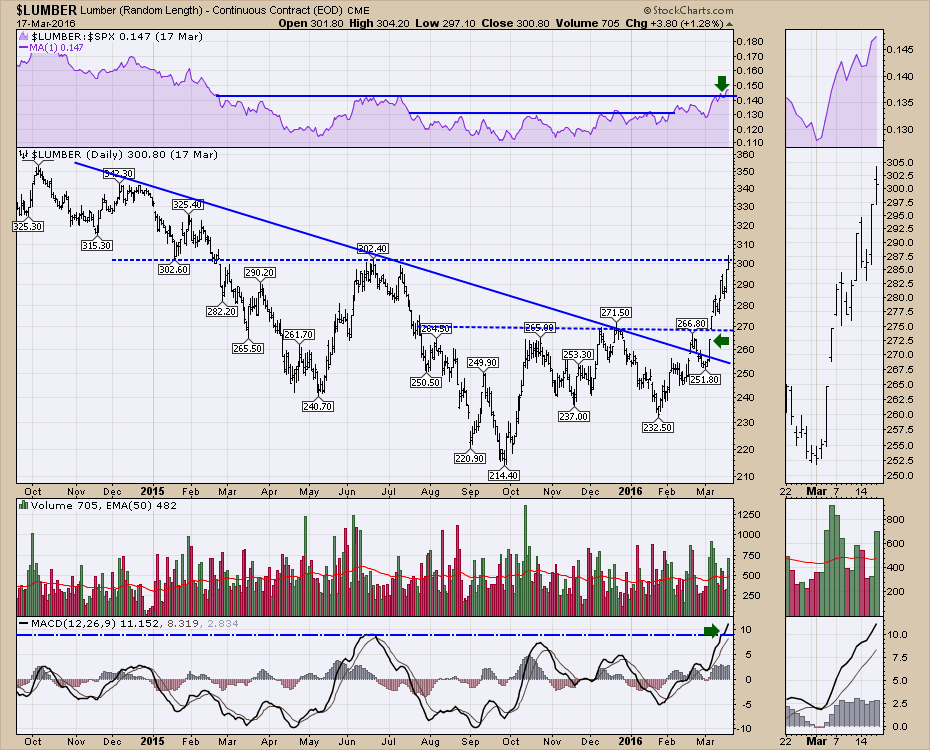
ChartWatchers March 05, 2016 at 01:49 AM
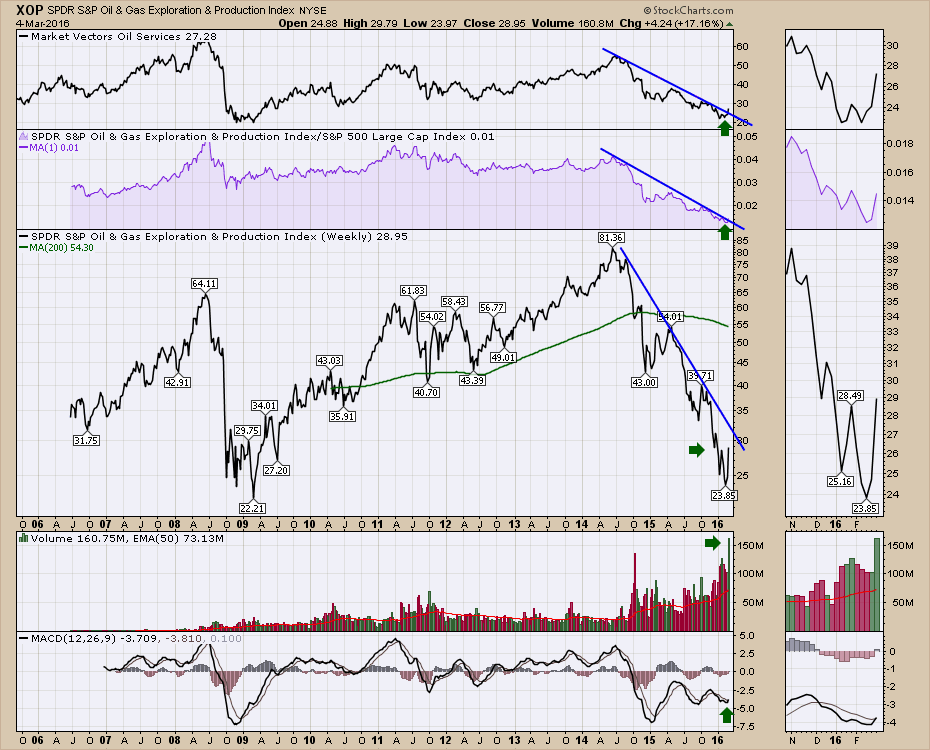
This week did a lot to shake my resolve on the continuing bear market in the energy sector. Let's look at three charts and discuss why they are at critical levels... Read More