ChartWatchers April 16, 2016 at 12:11 PM
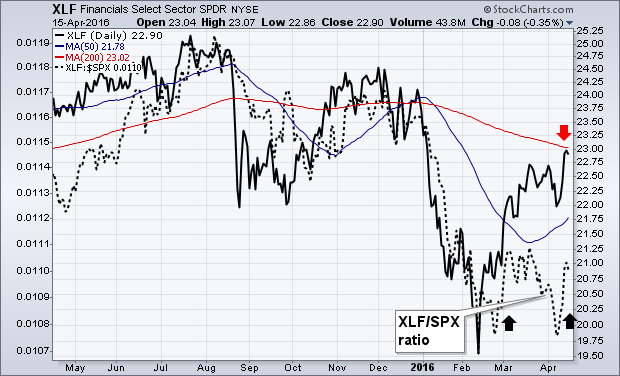
FINANCIALS HAVE A STRONG WEEK... Financials went from the year's weakest sector to the strongest gainer this past week. Chart 1 shows the Financials Sector SPDR (XLF) climbing to the highest level in three months and challenging its 200-day moving average (red arrow)... Read More
ChartWatchers April 16, 2016 at 12:06 PM
Alcoa reported its numbers after the bell last Monday which served as the kick off for first quarter earnings season. This was followed by a few big banks and then next week we'll get hundreds of more companies reporting their numbers... Read More
ChartWatchers April 16, 2016 at 10:40 AM
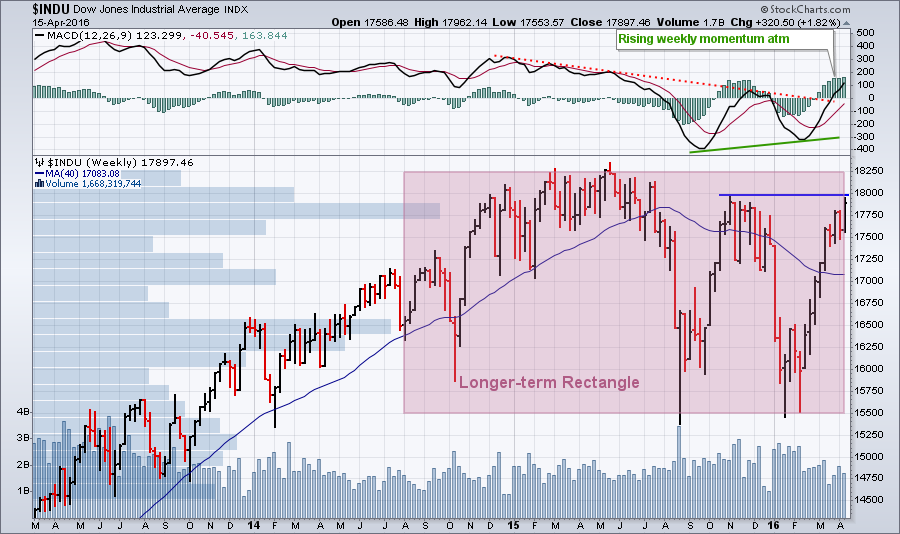
Hello Fellow ChartWatchers! After pausing 5 days to catch its breath, the Dow powered higher this week and is close to breaking overhead resistance from the peak set last November... Read More
ChartWatchers April 16, 2016 at 10:01 AM
Based on April performance alone over the past 20 years, the best industry groups to invest in have been the following: $DJUSHL (Hotels & Lodging REITs) +12.4% $DJUSAU (Automobiles) +10.3% $DJUSRL (Retail REITs) +9.7% $DJUSES (Real Estate Services) +8.9% $DJUSTR (Tires) +7... Read More
ChartWatchers April 16, 2016 at 08:16 AM
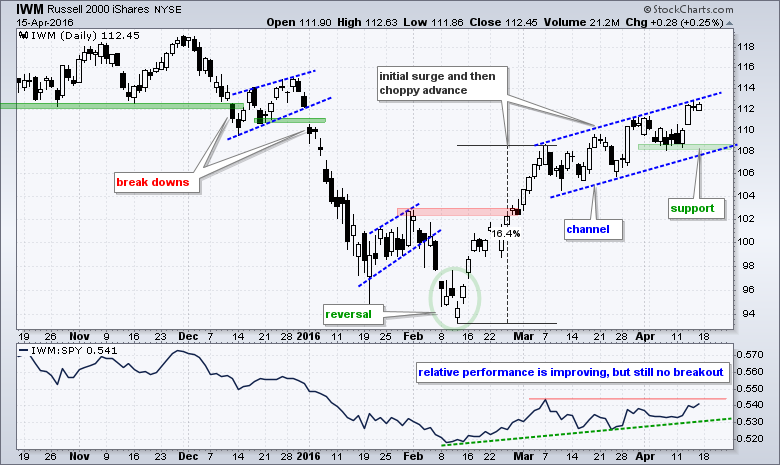
It was a pretty good week for the stock market with the Russell 2000 iShares (IWM) and the Finance SPDR (XLF) showing upside leadership for a change. IWM gained 3.21% for the week and led the major index ETFs higher. XLF gained 4... Read More
ChartWatchers April 03, 2016 at 03:14 PM
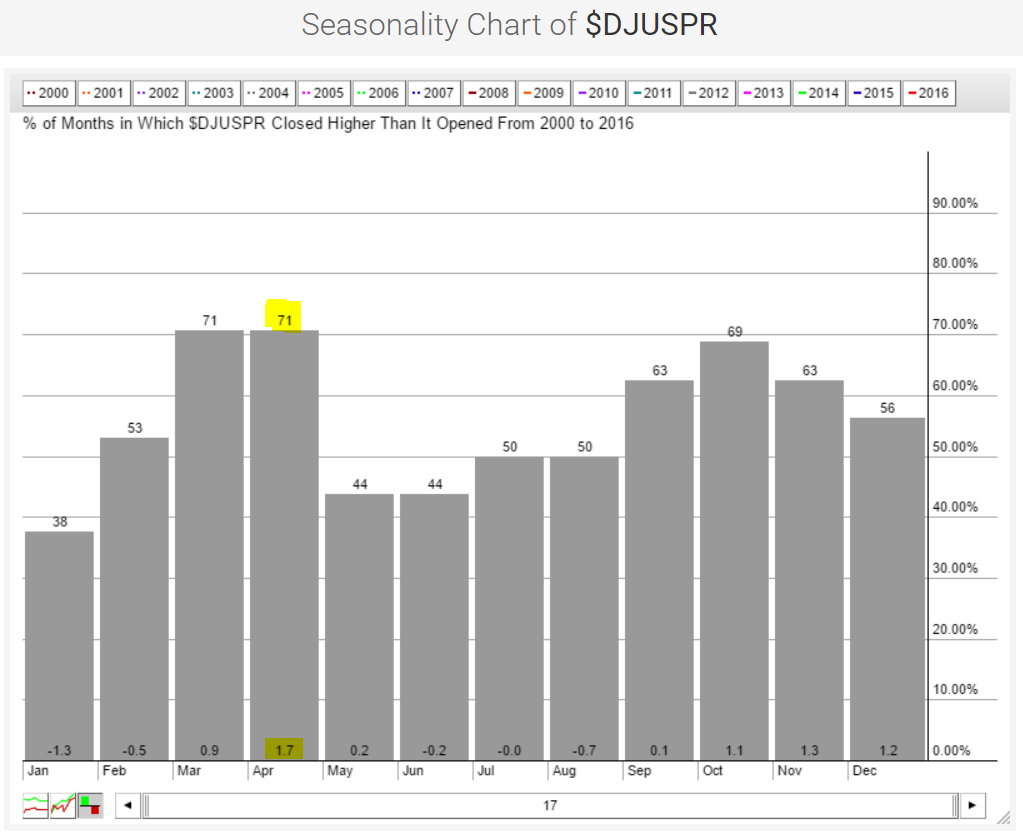
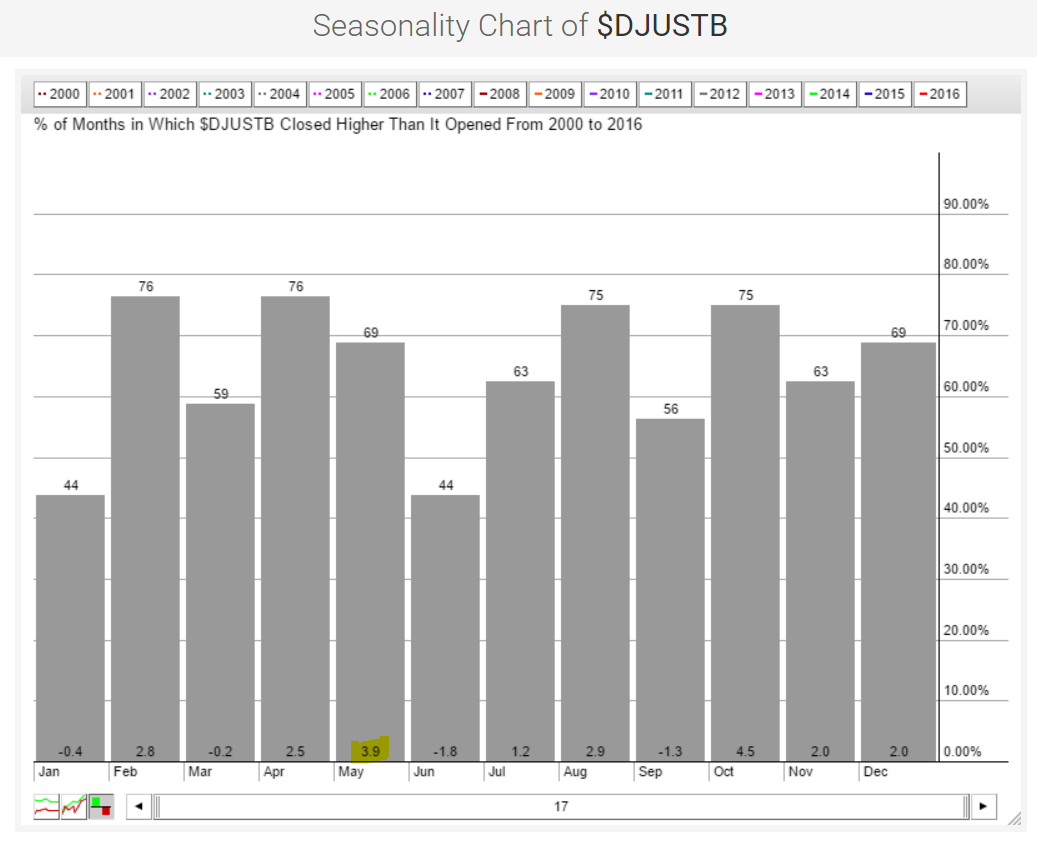
The seasonality tool here at StockCharts.com provides an easy way to review historical results for indices, sectors, industry groups and individual stocks... Read More
ChartWatchers April 03, 2016 at 12:20 PM
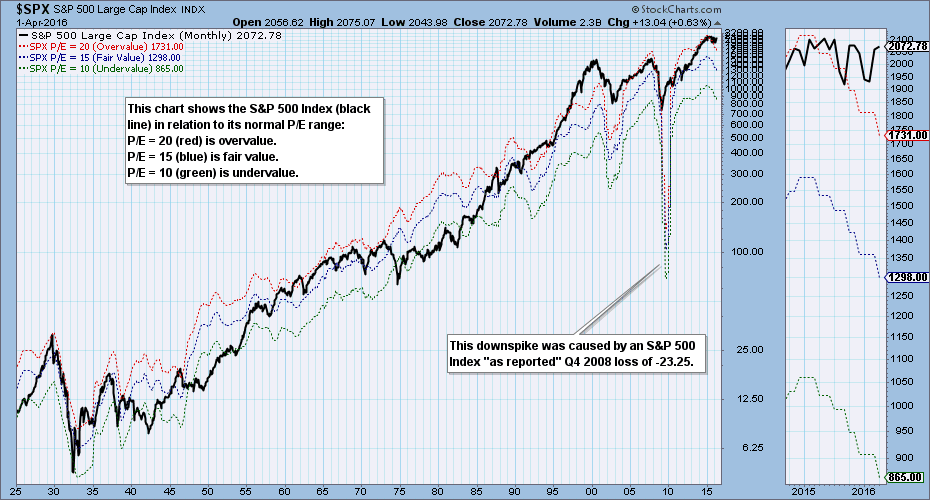
The preliminary S&P 500 Index 2015 fourth quarter earnings results are in, and it is once again time to look at our earnings chart, which shows the S&P 500 in relation to its normal value range. (Note: The chart is a static graphic, not an active chart... Read More
ChartWatchers April 03, 2016 at 12:07 PM
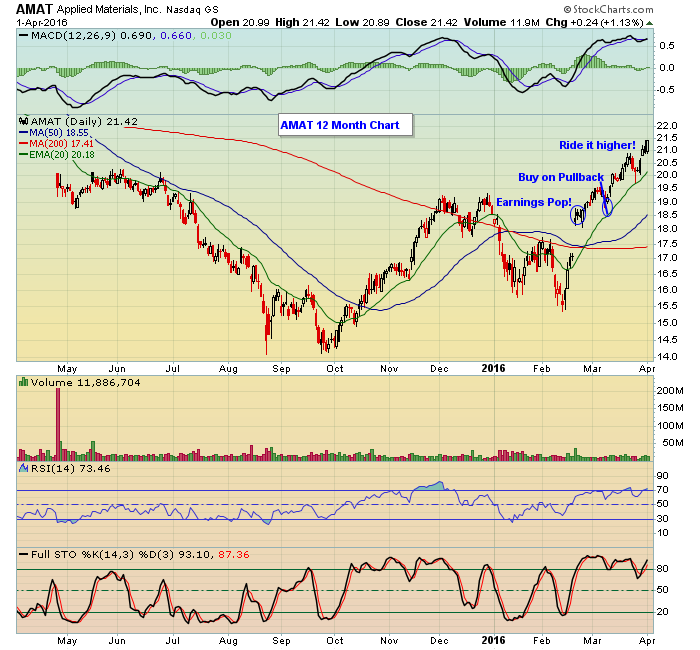
The first quarter has come and gone and now we are about to embark upon another earnings season that will officially kick off when Alcoa reports its numbers after the bell on Monday, April 11... Read More
ChartWatchers April 03, 2016 at 11:14 AM
Hello Fellow ChartWatchers! The markets continue to power higher with the S&P 500, Nasdaq and Wilshire 5000 all joining the Dow Jones Industrials in the "Above the 200-Day Moving Average" club. The Dow is now challenging its big overhead resistance area around 17,750... Read More
ChartWatchers April 02, 2016 at 05:40 PM
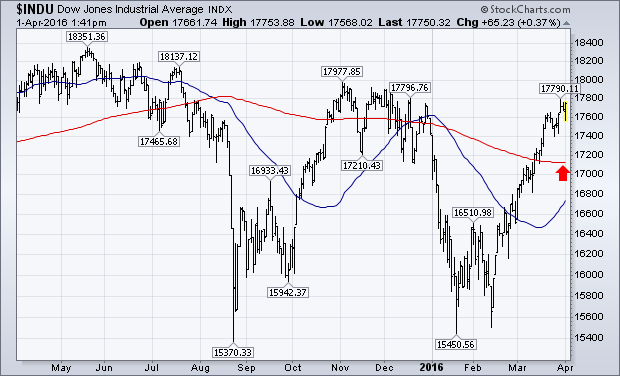
The chart below shows the Dow Industrials moving closer to a test of its fourth quarter highs near 18000. Given the steepness of the recent rally, it might run into some resistance there. But its trend is still higher... Read More
ChartWatchers April 02, 2016 at 03:04 PM
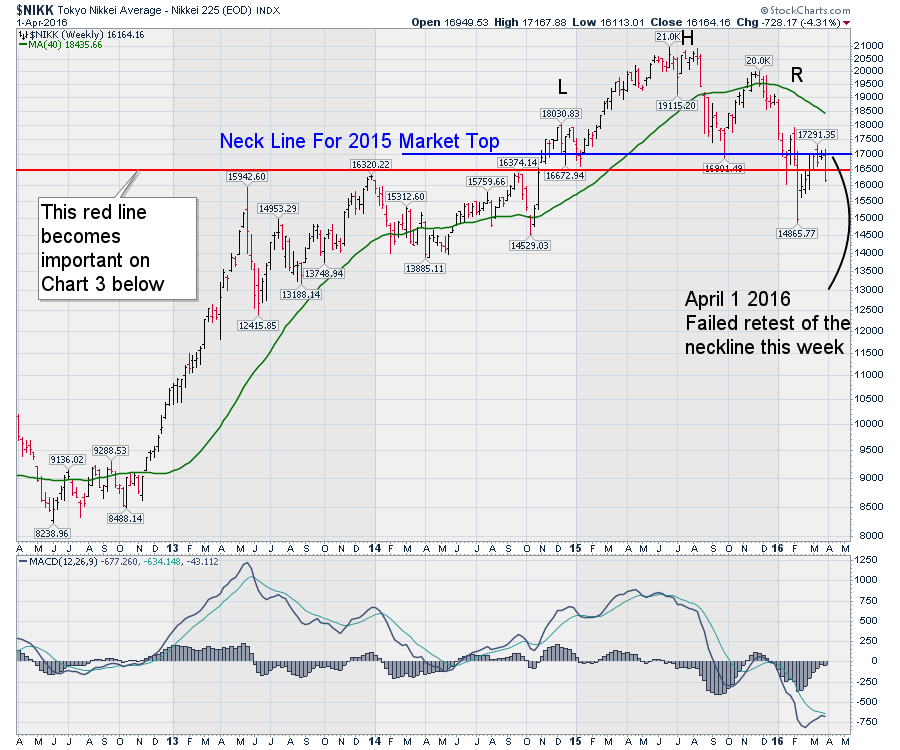
If the Dow fell 900 points in two days, would that get our attention? This article will explain the linkage for North American investors and why I say it so succinctly. The continued case for watching price action rather than Monetary Policy has resumed in Europe and Japan... Read More