ChartWatchers June 26, 2020 at 11:27 PM
On June 10th, the Federal Reserve held their meeting and the stock market struggled on the Thursday after that, down 5% on the day... Read More
ChartWatchers June 26, 2020 at 09:21 PM
On Friday, April 3, I submitted my article for the ChartWatchers newsletter with the following headline: "Get Ready to be Shocked - To the Upside"... Read More
ChartWatchers June 26, 2020 at 07:06 PM
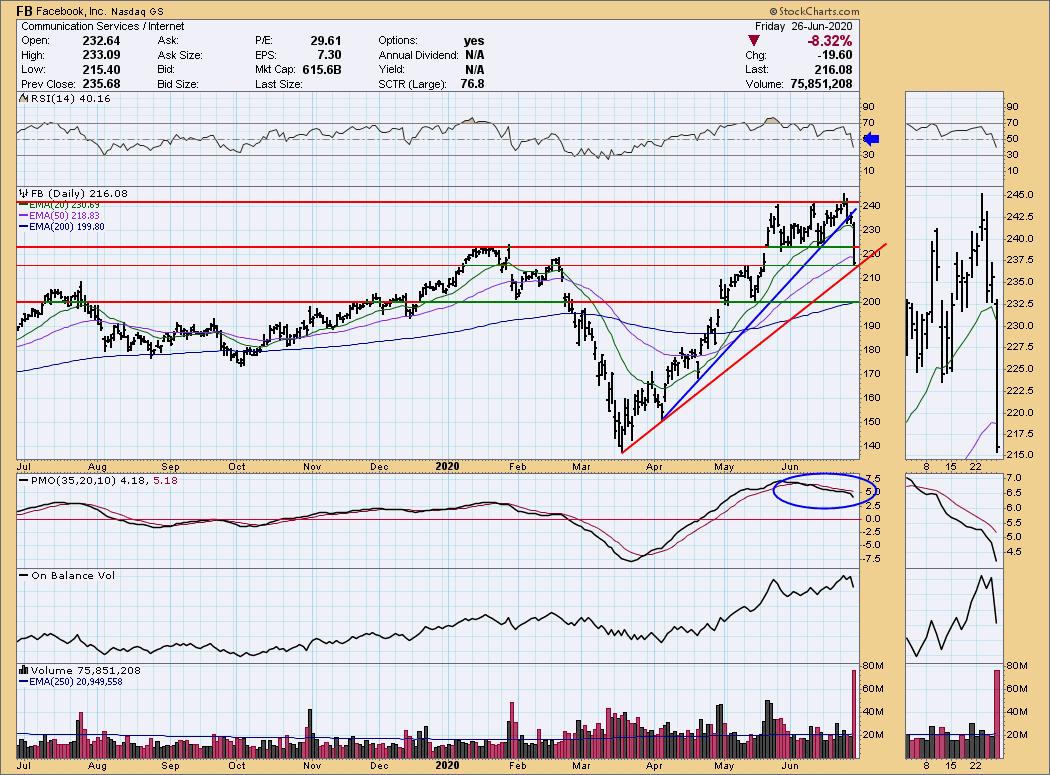
I decided to take a look at the FAANG stocks to see which ones are experiencing damage (duds) and which ones are continuing to show internal strength despite the S&P 500 stalling before reaching all-time highs. There are definitely some winners and losers... Read More
ChartWatchers June 26, 2020 at 07:03 PM
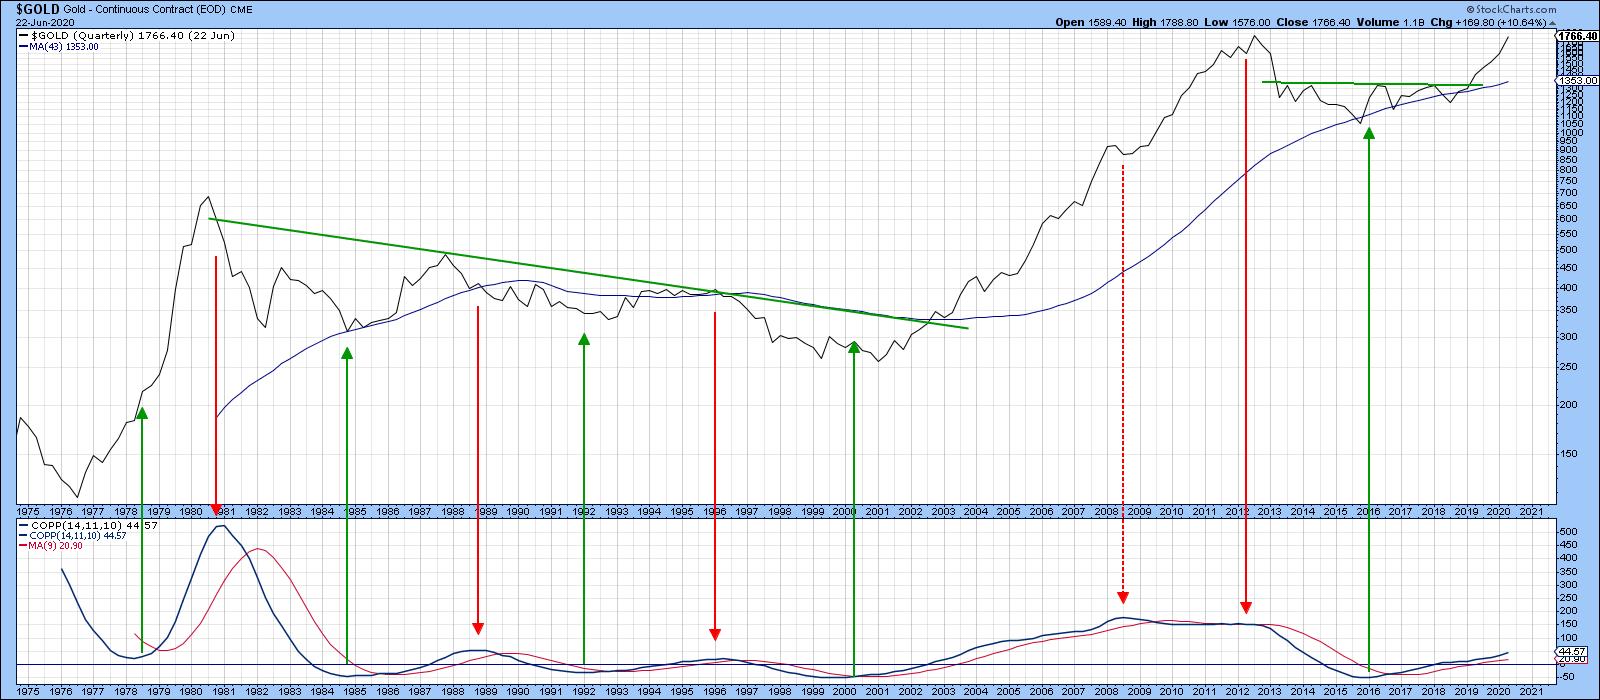
Long-Term Gold Charts Give Perspective Gold broke out to a new recovery high on Tuesday and looks set to gain more ground, all with a favorable background from the long-term trend. Chart 1 compares the quarterly gold price to a Coppock indicator and its 9-quarter moving average... Read More
ChartWatchers June 26, 2020 at 04:36 PM

The 200-day SMA is a long-term trend indicator that chartists can use across the equal-weight sectors to measure the balance of power in the broader market. The more sectors trading above their 200-day SMAs, the more bullish the market... Read More
ChartWatchers June 20, 2020 at 12:13 AM
The markets have been able to climb a wall of worry over the past 3 months in a move that's pushed the Nasdaq to a new high in price, with the S&P 500 within 6% of its peak reached in mid-February... Read More
ChartWatchers June 19, 2020 at 10:00 PM
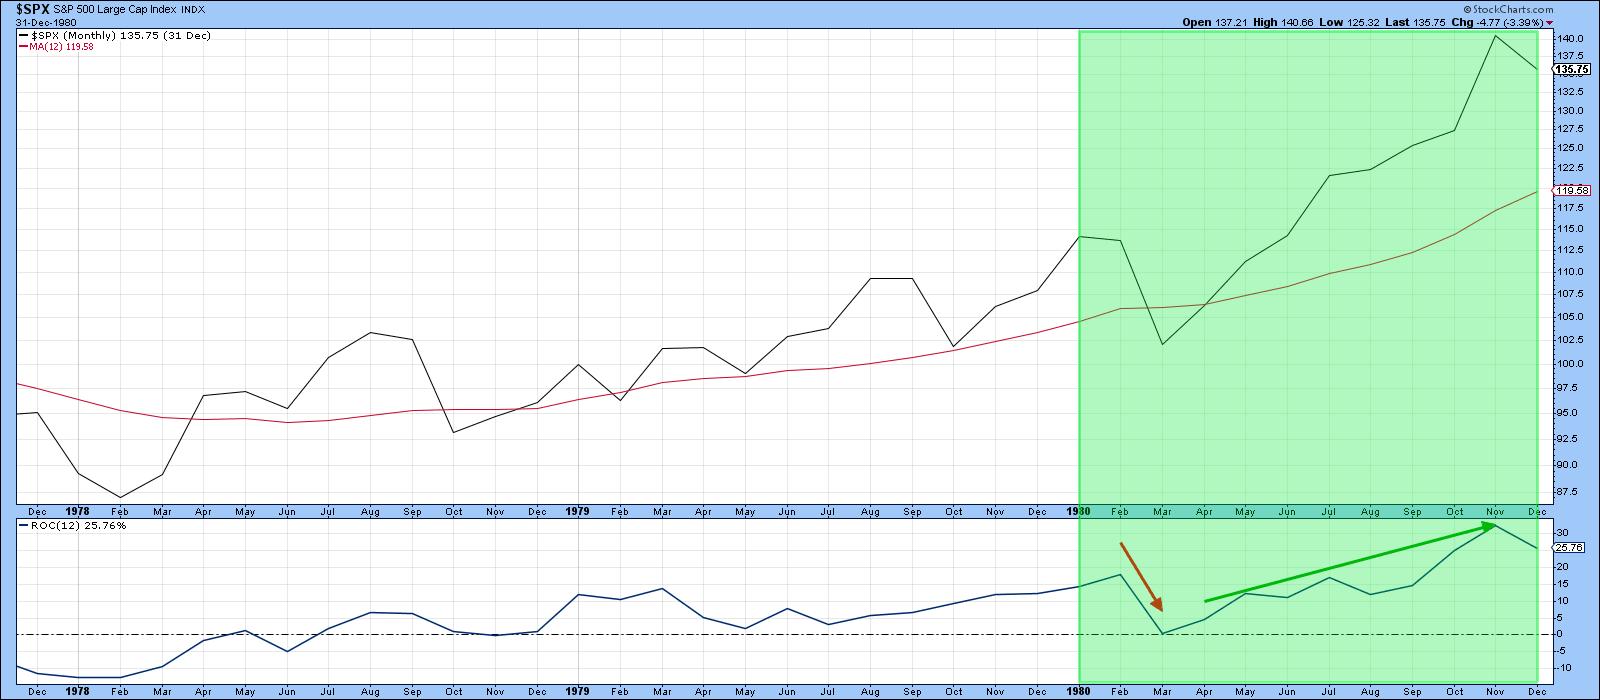
The simple answer to the question posed in the title is "No!". However, there are a number of interesting parallels that have implications for 2020 and beyond. Let's see what they are... Read More
ChartWatchers June 19, 2020 at 09:12 PM
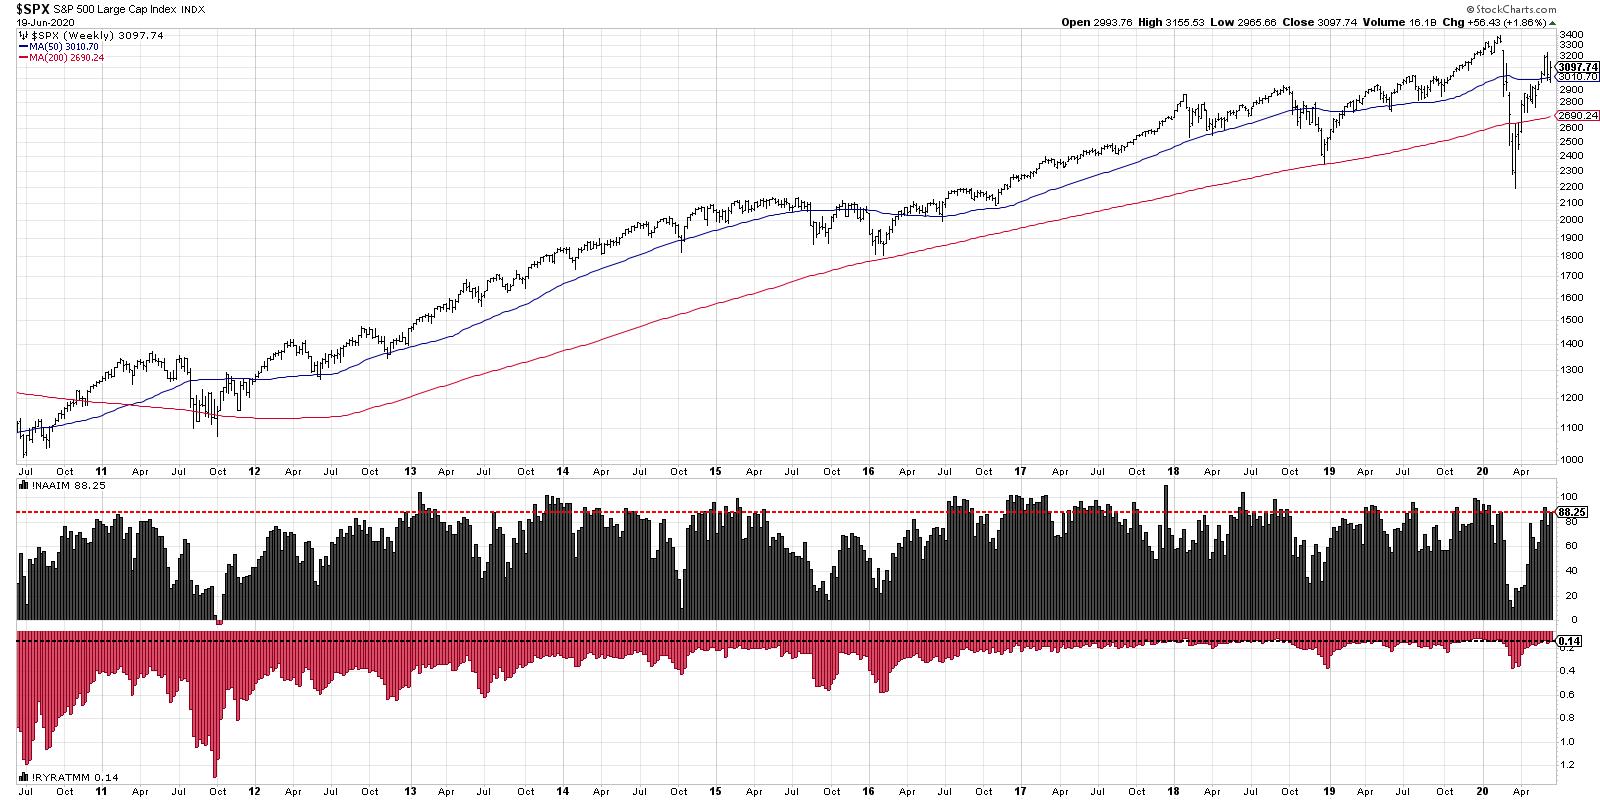
When I'm prioritizing information to help me understand the broad market environment, I tend to consider this as the order of importance: Price Breadth Sentiment I've found sentiment readings such as the American Association of Individual Investors (AAII) and Investors Intelligen... Read More
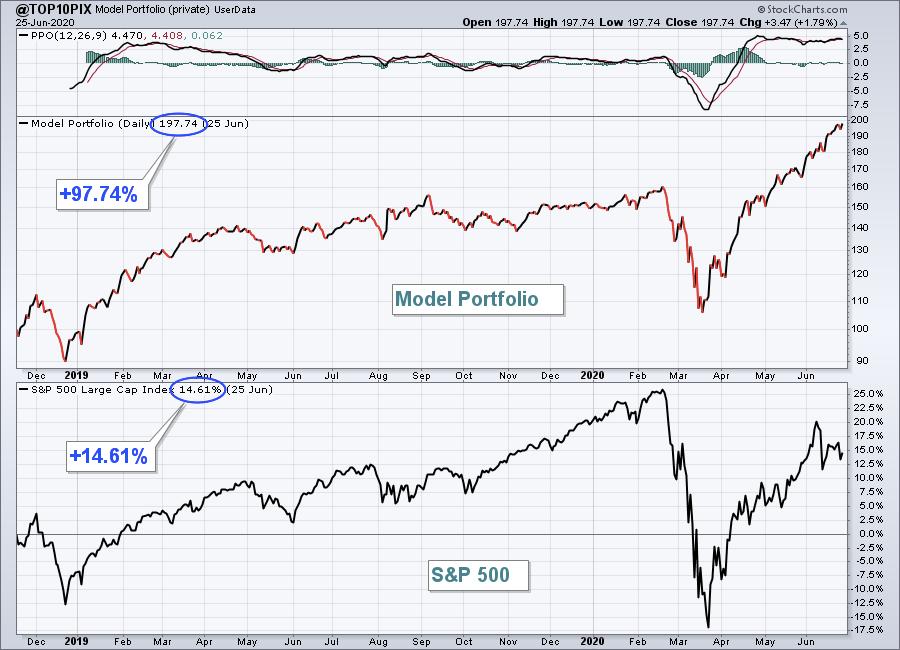
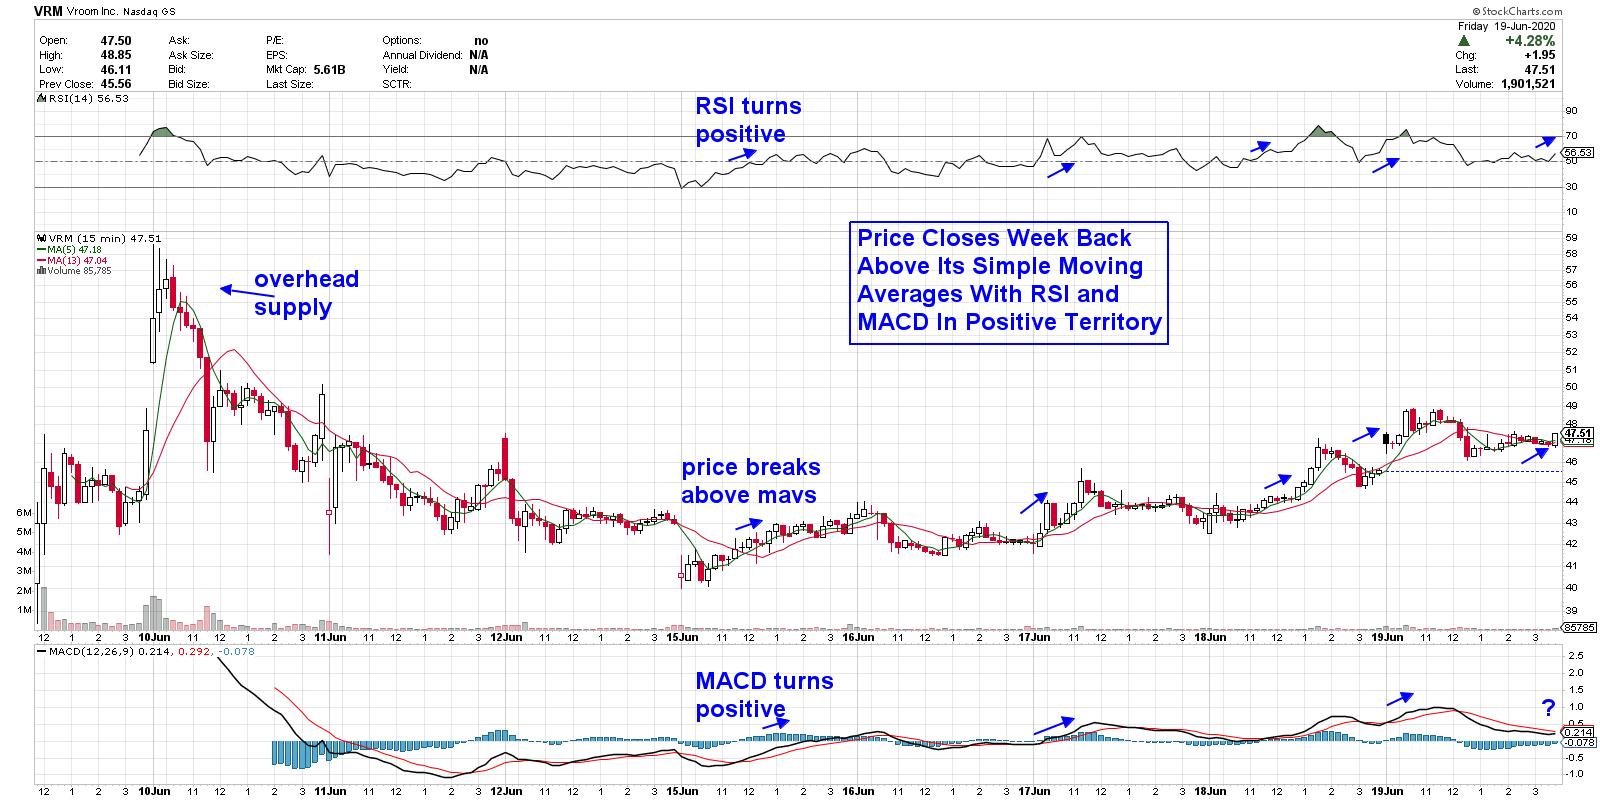
ChartWatchers June 19, 2020 at 09:02 PM
I am constantly performing research, using my analytical skills to uncover the best stock market opportunities. At EarningsBeats.com, we have a proven process of identifying leading stocks in leading industries... Read More
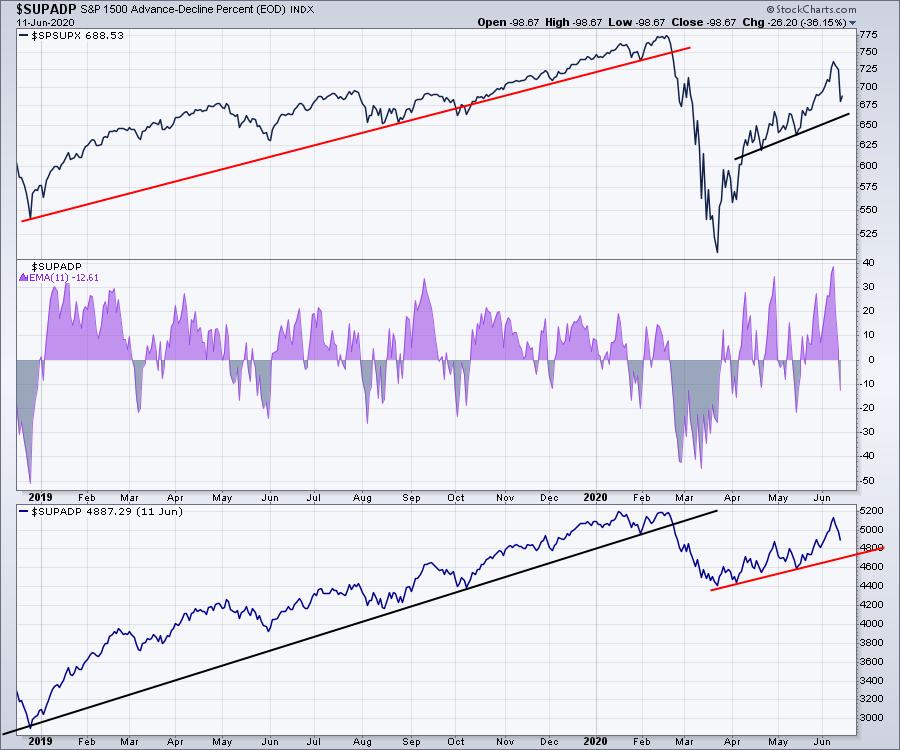
ChartWatchers June 19, 2020 at 01:23 PM

Technical analysts use a lot of breadth data in their work, which is understandable as it can give us a lot of useful information about how a market as a whole, usually a broad index level, behaves... Read More
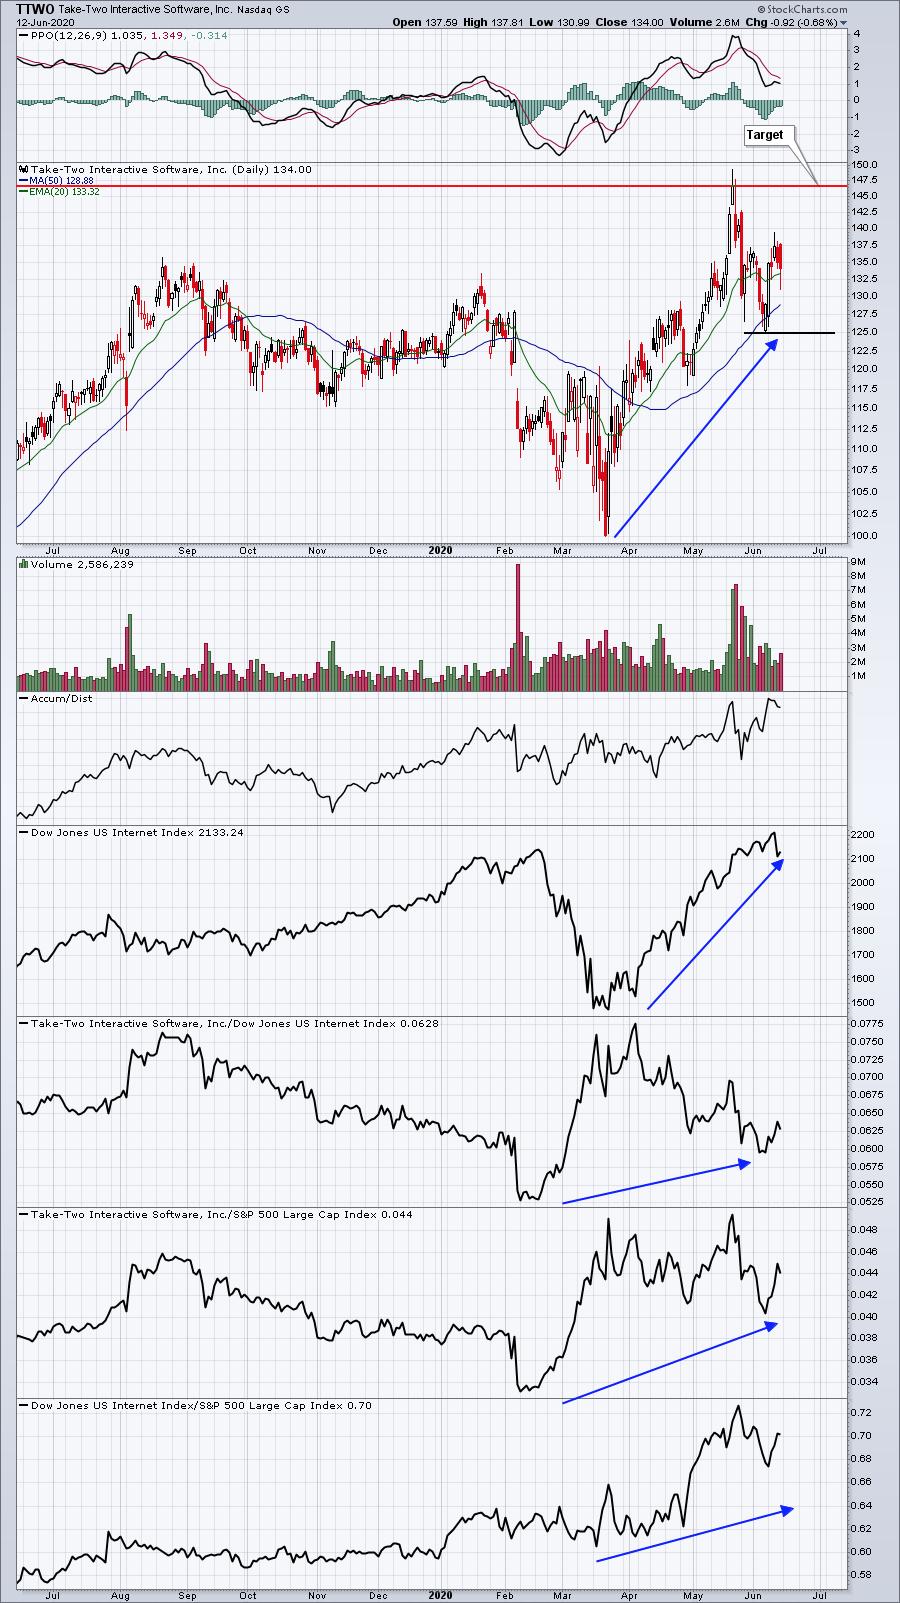
ChartWatchers June 12, 2020 at 11:30 PM

We're back with another new edition of The Pitch, this month featuring Greg Schnell, Julius de Kempenaer and Mary Ellen McGonagle, hosted by Tom Bowley. Each analyst has come prepped with their five most compelling stock picks for the current market environment... Read More
ChartWatchers June 12, 2020 at 06:59 PM
Every day, there are thousands of companies to select from when looking for trading candidates. This includes companies in different sectors, of different sizes and with different prices... Read More
ChartWatchers June 12, 2020 at 06:14 PM
I remember hearing (and still hearing) from other analysts that one should remember that the bottom of the chart isn't a support level. This is especially true when you are looking at a stock that has been making new all-time lows... Read More
ChartWatchers June 12, 2020 at 04:35 PM

The 20+ Yr Treasury Bond ETF (TLT) retreated as stocks advanced from mid April to early June and then popped as stocks dropped this week. Bonds are the natural alternative to stocks and TLT appears to be forming a classic bullish continuation pattern... Read More
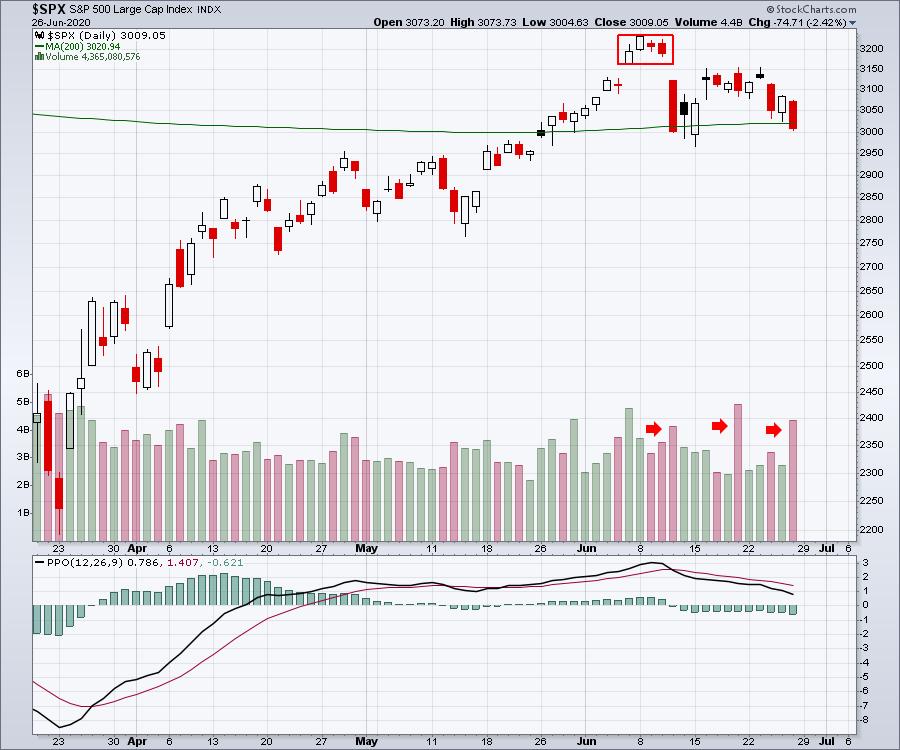
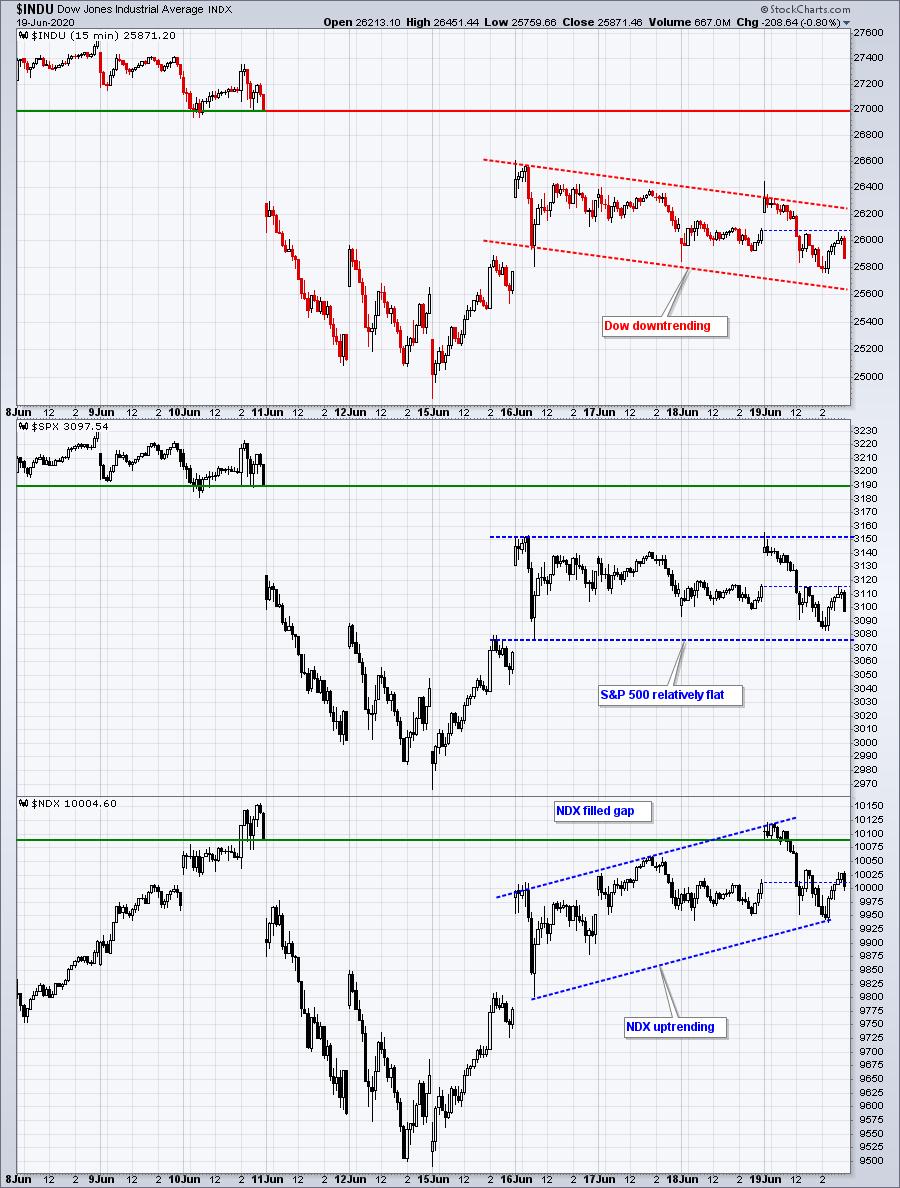
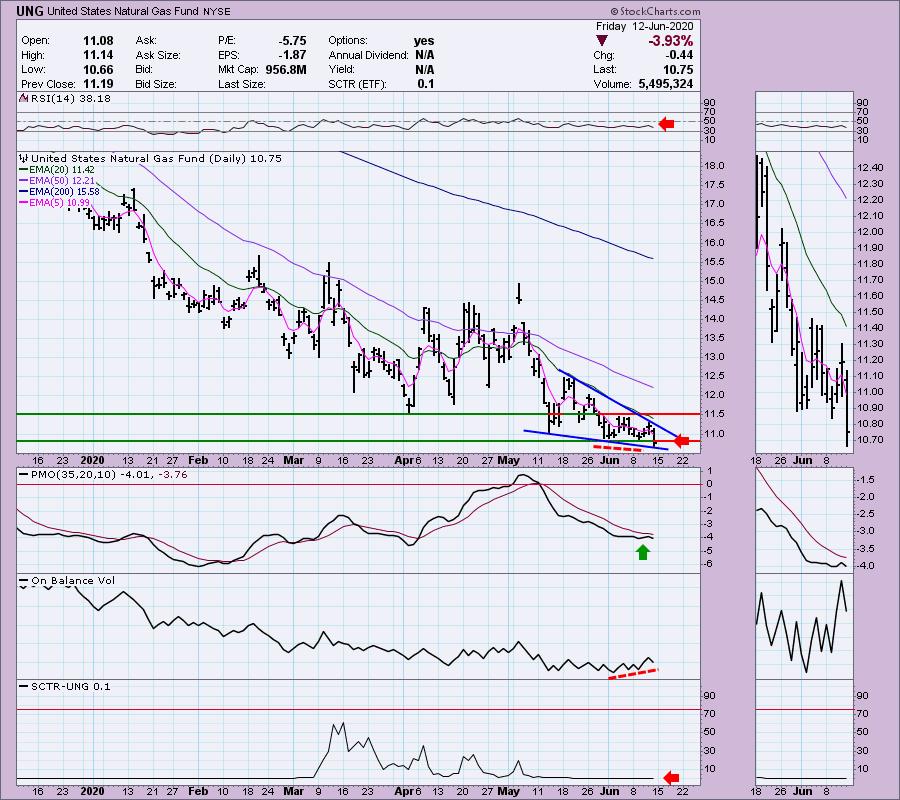
ChartWatchers June 12, 2020 at 01:06 PM
Thursday was a real portfolio rattler as most stocks went for a wild dip. Once again, the Fed meeting was one of the primary reasons for the renewed cautiousness... Read More
ChartWatchers June 05, 2020 at 10:16 PM
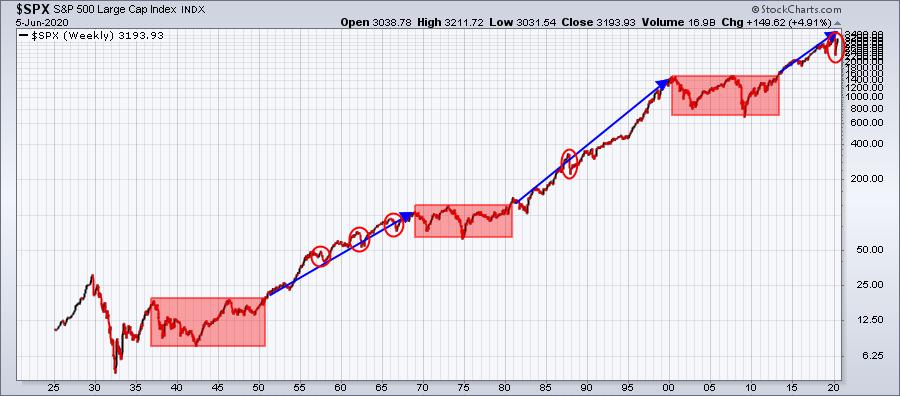
I've never understood the attraction to short selling, especially in a secular bull market. I get it - March and April didn't really feel like a big time bull market. But it was still part of one. March represented a cyclical bear market in a massive secular bull market... Read More
ChartWatchers June 05, 2020 at 10:00 PM
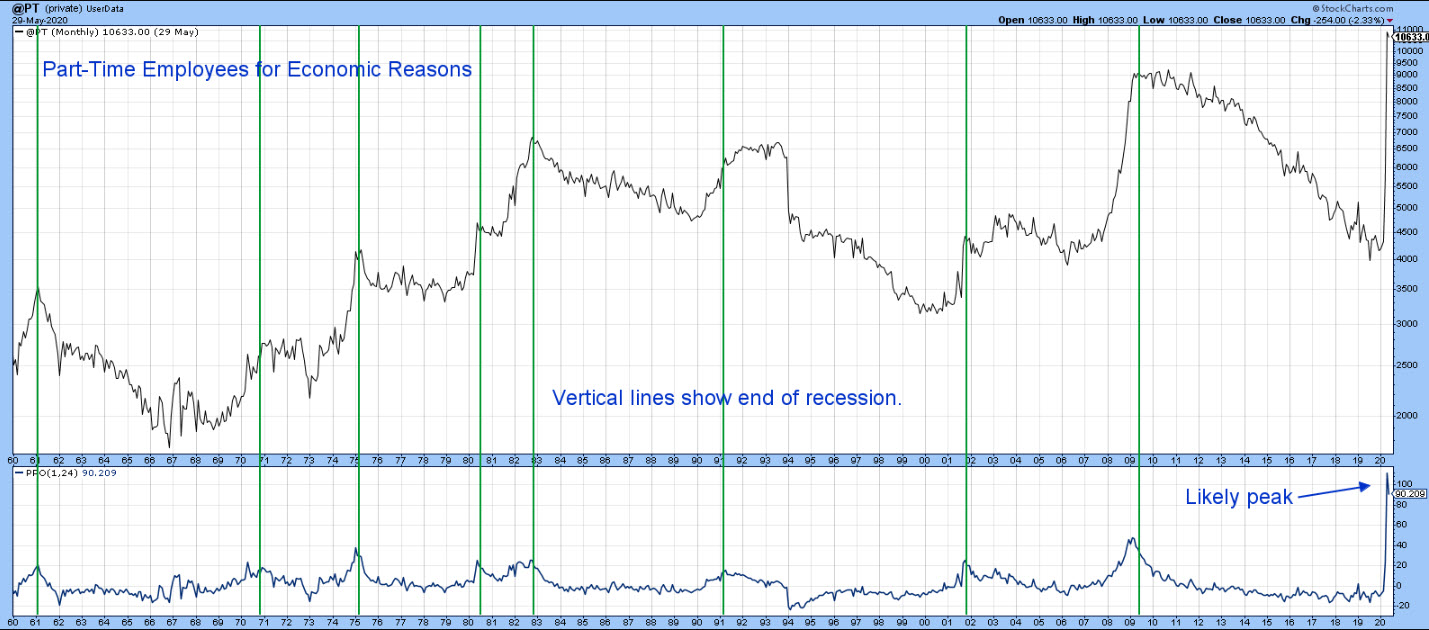
Part-Time Employees for Economic Reasons is a leading indicator of the labor market. That's because employers are more inclined to hire and fire temporary workers than permanent ones, where labor laws, contracts, pensions and other impediments get in the way... Read More
ChartWatchers June 05, 2020 at 08:56 PM
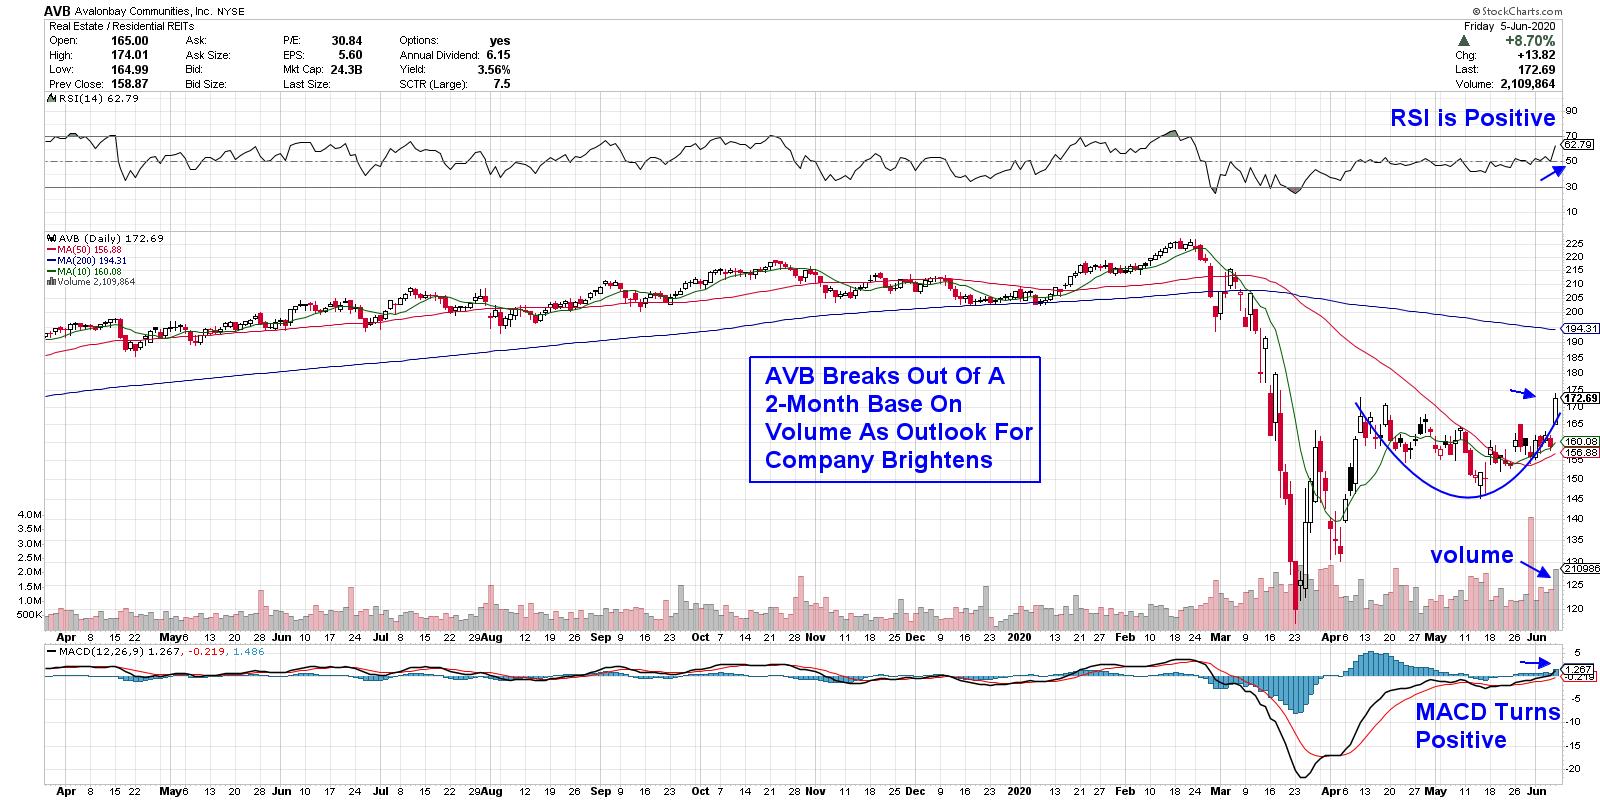
Extreme uncertainty can really push stocks around, and this historically unprecedented pandemic has certainly proven that. Take the steep selloff in normally defensive Utility and Real Estate stocks... Read More
ChartWatchers June 05, 2020 at 08:49 PM
Every Friday on The Final Bar, I conduct a weekly chart routine called "Wrap the Week" where we review macro charts and how they've evolved over the previous seven days... Read More
ChartWatchers June 05, 2020 at 04:21 PM

The title for this article is a quote from John Murphy's book Trading with Intermarket Analysis. And I couldn't help but think of it when I was watching the Relative Rotation Graph that shows the rotation for different segments of market capitalization... Read More