Don't Ignore This Chart! December 31, 2014 at 10:08 AM
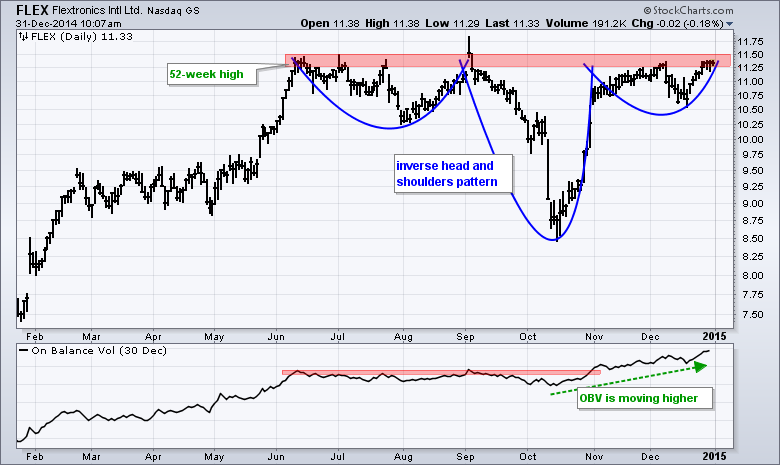
Flextronics (FLEX) hit a 52-week high in June and then formed an extended consolidation that looks like an inverse head-and-shoulders pattern. It is not picture perfect, but the "essence" of the pattern is there... Read More
Don't Ignore This Chart! December 30, 2014 at 07:38 PM

Fossil (FOSL) is an interesting chart as we head into the newest Apple product launch in 2015, the Apple Watch. While the trail of punished companies that thought they would be able to compete with Apple's depth is long, it always seems to take trusting shareholders by surprise... Read More
Don't Ignore This Chart! December 29, 2014 at 07:00 AM
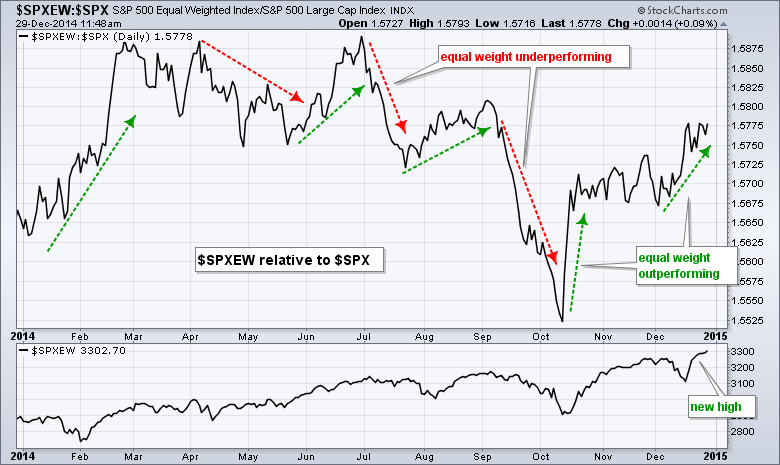
The chart below shows the ratio of the S&P 500 Equal-Weight Index to the S&P 500 ($SPXEW:$SPX). Also known as the price relative, this ratio chart compares the performance of the S&P 500 Equal-Weight Index to the S&P 500... Read More
Don't Ignore This Chart! December 26, 2014 at 09:48 AM
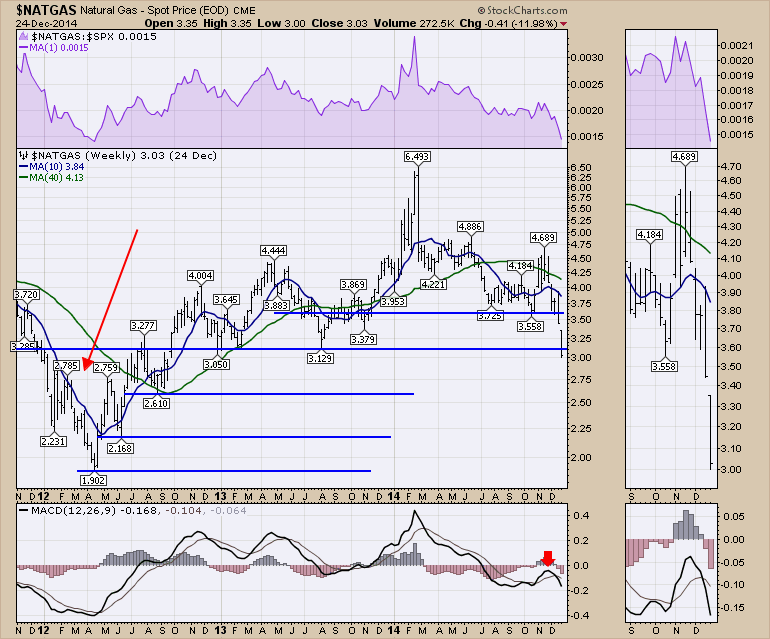
$NATGAS had been struggling to hold up in the wake of the recent energy downturn, but in the last week pricing fell apart. After a vertical climb from the very low $1.90 level to a soaring $6... Read More
Don't Ignore This Chart! December 23, 2014 at 04:07 PM
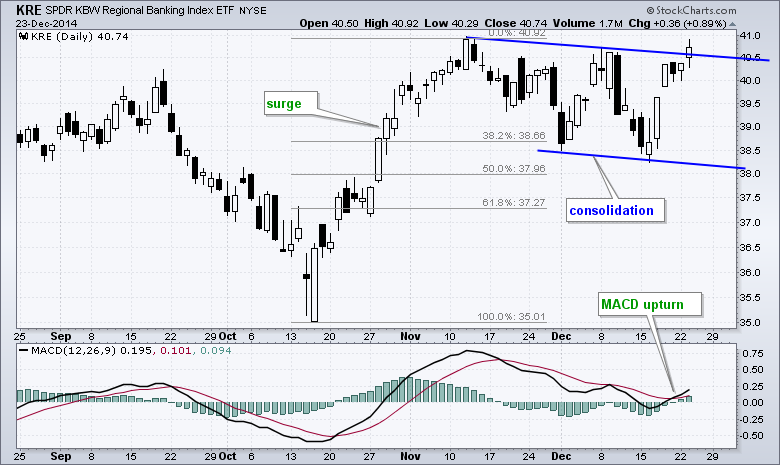
The Regional Bank SPDR (KRE) is showing potential with a break above the flag trend line. Notice how the ETF surged and then corrected with the falling flag... Read More
Don't Ignore This Chart! December 22, 2014 at 12:32 PM
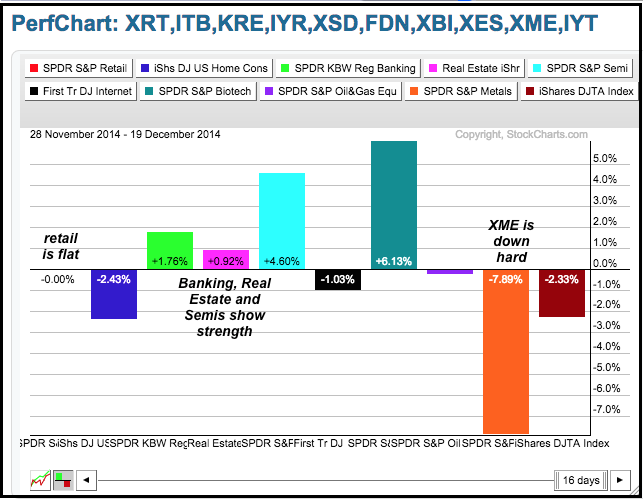
December has been one mixed up month. The Nasdaq 100 ETF (QQQ) is down around 1.1%, the Russell 2000 iShares (IWM) is up around 2% and the S&P 500 SPDR (SPY) is up .30%. We can also see mixed results when looking at the Performance for 10 key industry group ETFs... Read More
Don't Ignore This Chart! December 18, 2014 at 09:10 AM
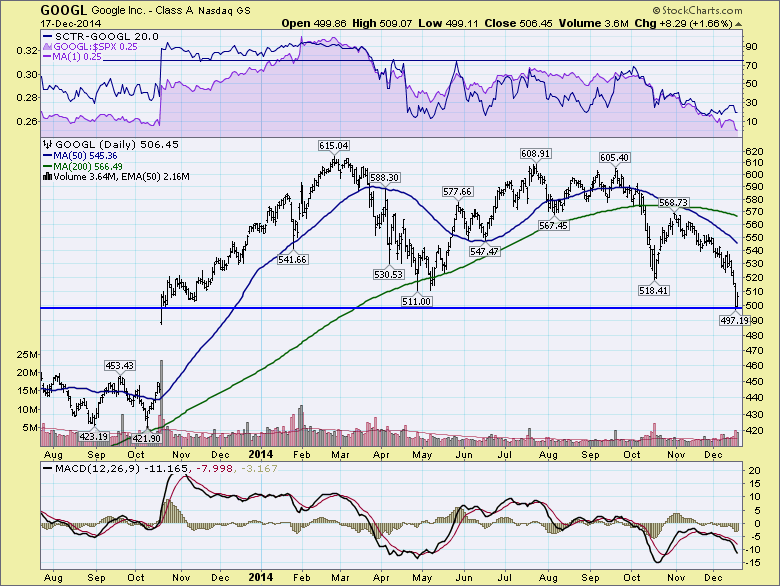
Google (GOOGL) is one of the great pioneering companies of our time. We use it every day and if someone tries to avoid using Google, it is almost impossible... Read More
Don't Ignore This Chart! December 17, 2014 at 11:45 AM
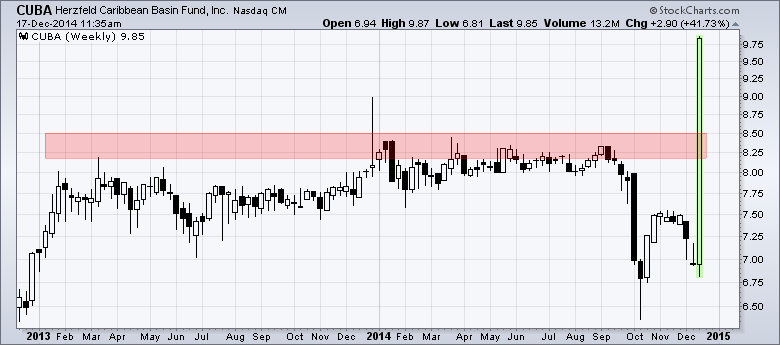
Cuba is in the news today on the announcement that the US and Cuba will start talks to normalize ties. What does Cuba have to do with a Technical Analysis website? Well....I was looking at the most actives on the Nasdaq and saw CUBA with a 40+ percent gain on big volume... Read More
Don't Ignore This Chart! December 16, 2014 at 04:56 AM
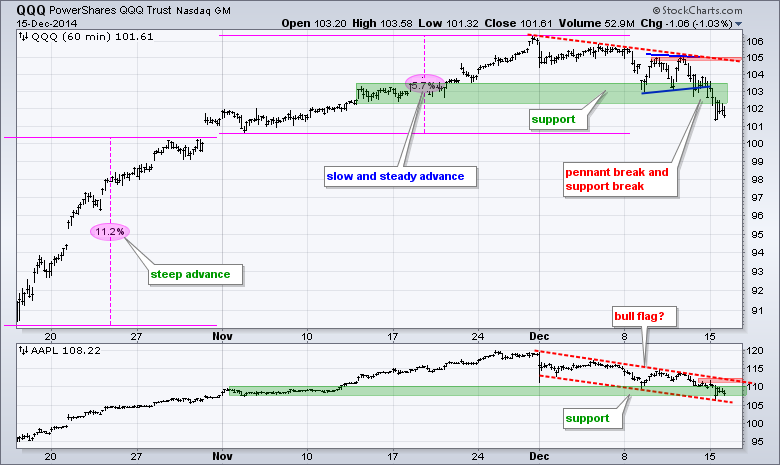
QQQ broke pennant support on Friday and continued below 102 on Monday to break its support zone. The early December trend line and last week's highs mark resistance at 105. Apple continues to work its way lower and I am marking resistance at 112... Read More
Don't Ignore This Chart! December 15, 2014 at 03:59 PM
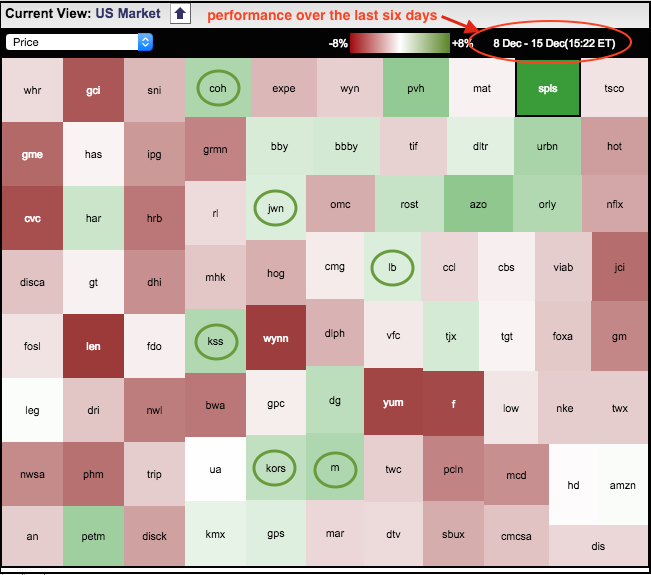
The S&P 500 was hit pretty hard over the last six days with all nine sectors losing ground. There were, however, some pockets of strength in the consumer discretionary. The Sector Market Carpet shows performance for the consumer discretionary sector since last Monday, 8-December... Read More
Don't Ignore This Chart! December 13, 2014 at 04:18 PM

Teekay Tankers (TNK) is a shipper of Crude Oil. With crude oil plummeting, why would shippers be busy? Well, holding spot price crude on a ship till the price improves can be a hedge fund's game. It looks to me that this might be what's going on... Read More
Don't Ignore This Chart! December 11, 2014 at 10:30 AM
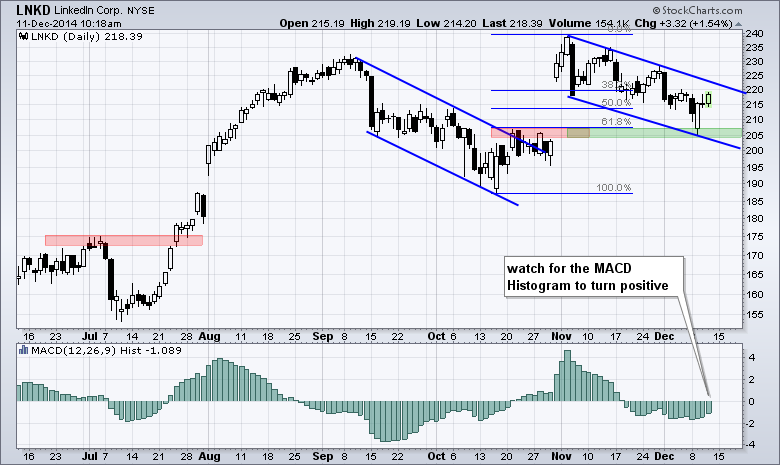
LinkedIn broke out and surged to a new high in early November, and then corrected the last five weeks with a falling channel. This channel retraced 62% of the prior surge and almost filled the gap, but didn't... Read More
Don't Ignore This Chart! December 10, 2014 at 09:00 AM
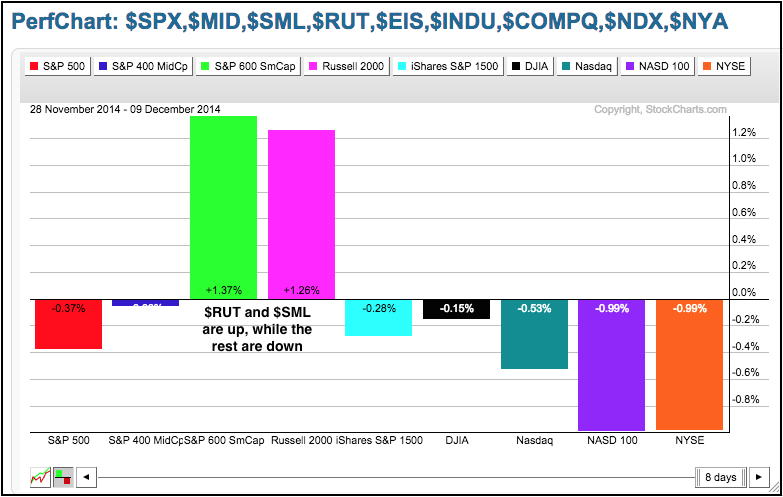
Small-caps are starting to live up to their reputation for outperformance in December. Even though the month is far from finished, the PerfChart below shows the Russell 2000 and the S&P Small-Cap 600 with 1+ percent gains so far... Read More
Don't Ignore This Chart! December 10, 2014 at 12:56 AM
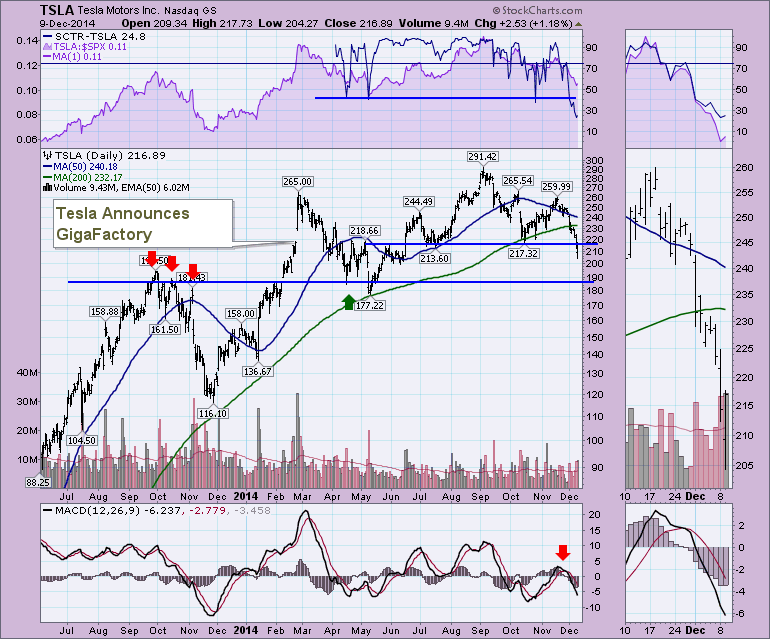
Tesla (TSLA) seems to be the talk of the town. The leader, Elon Musk, always has an interesting perspective on what is going to be big for the company. Since they launched their Gigafactory initiative, Tesla has been in a topping pattern... Read More
Don't Ignore This Chart! December 06, 2014 at 09:15 AM
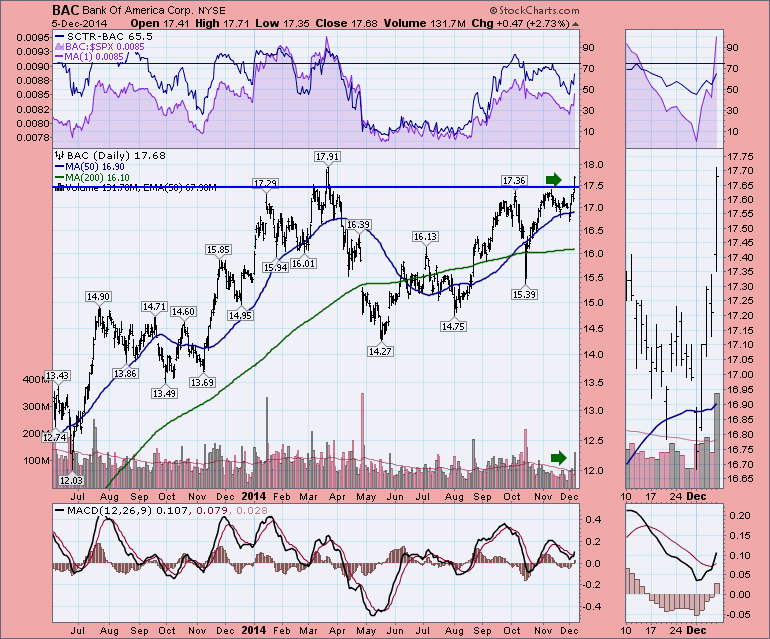
Bank of America (BAC) has been pausing at resistance for a while. But Friday it showed big interest with a nice volume surge. We can see it is sitting just below the spring time highs... Read More
Don't Ignore This Chart! December 05, 2014 at 12:00 PM
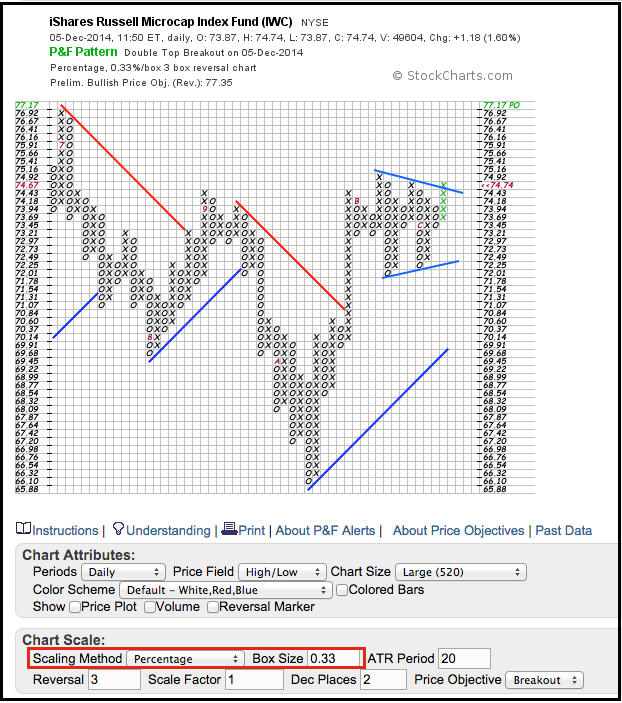
The Russell MicroCap iShares (IWC) is leading the market higher on Friday and breaking above a triangle trend line. The P&F chart shows the ETF surging in October and then consolidating in November... Read More
Don't Ignore This Chart! December 04, 2014 at 03:11 PM
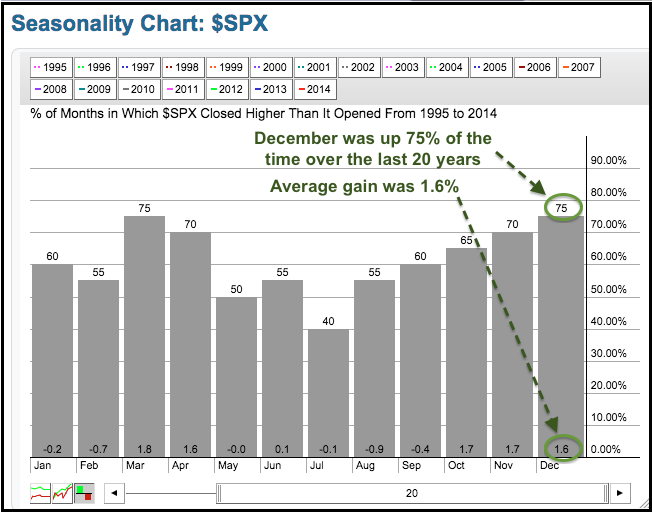
There has been a lot of chatter about the seasonal pattern for the S&P 500 in December, and it is bullish. StockCharts users do not need to rely on the chatter because they can chart seasonal patterns using our Seasonality Tool and see for themselves... Read More
Don't Ignore This Chart! December 03, 2014 at 09:00 AM
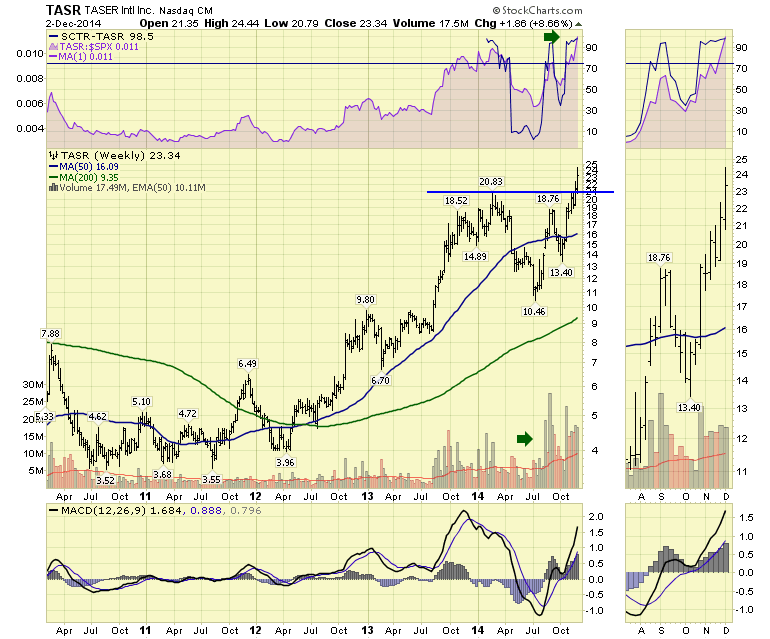
Taser (TASR) is developing cameras for the police forces around the world. Here is the chart. The Relative Strength shown in purple is up trending and the SCTR is one of the best.The stock has consolidated for a year and is now breaking out on high volume... Read More
Don't Ignore This Chart! December 02, 2014 at 05:16 PM
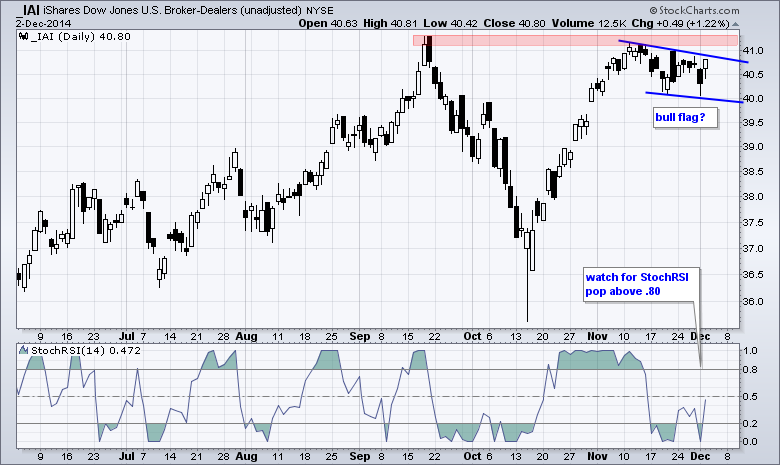
The Broker-Dealer iShares (IAI) surged to the September high and then stalled with a three week consolidation. With a downward slope, this consolidation looks like a falling flag, which is a bullish continuation pattern... Read More
Don't Ignore This Chart! December 01, 2014 at 03:14 PM
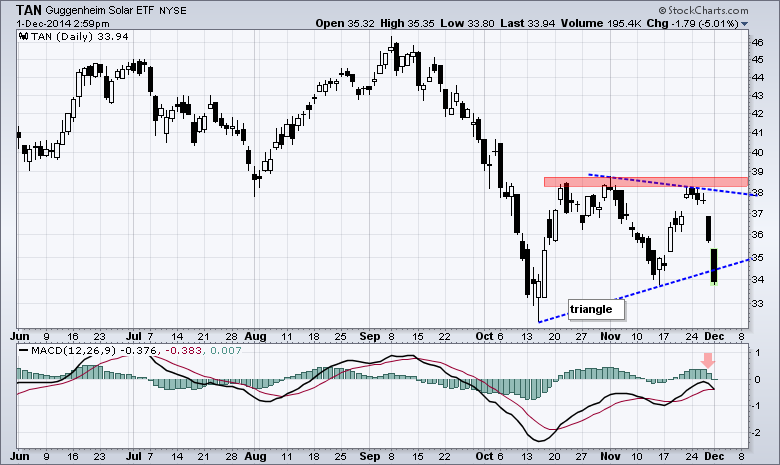
Lower energy prices may be making solar less competitive and putting pressure on solar-related stocks. The chart shows the Solar Energy ETF (TAN) breaking down in Sep-Oct, consolidating with a triangle and breaking triangle support with a sharp two-day decline... Read More