Don't Ignore This Chart! January 29, 2015 at 06:12 PM
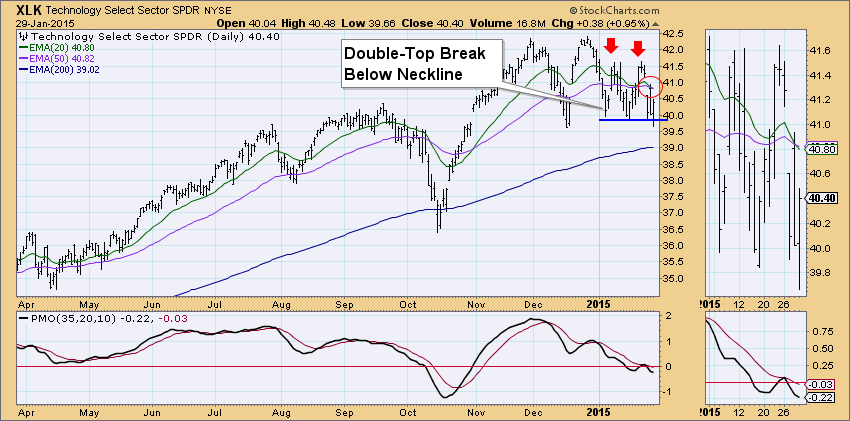
The Technology ETF (XLK) looks a lot like the SPY (see DecisionPoint Blog article, "Double-Top and Initiation Impulse Spell Trouble") which is not a good thing right now... Read More
Don't Ignore This Chart! January 29, 2015 at 01:23 PM
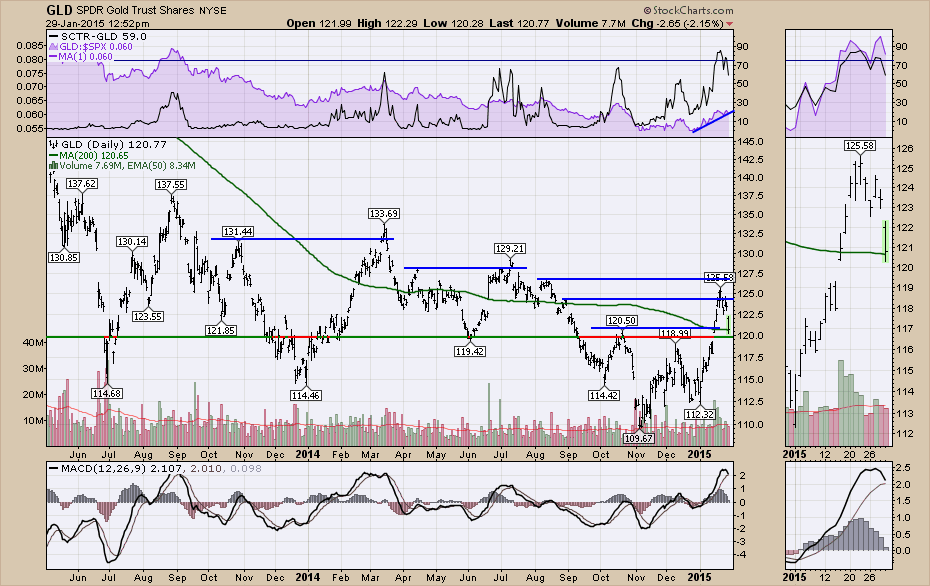
Gold is getting a rough ride the last few days. Today the Gold Tracking ETF (GLD) pulled back to test the 200 DMA. This is typically an important line in the sand. If it can hold here and start to move higher that would be significant... Read More
Don't Ignore This Chart! January 28, 2015 at 03:53 PM
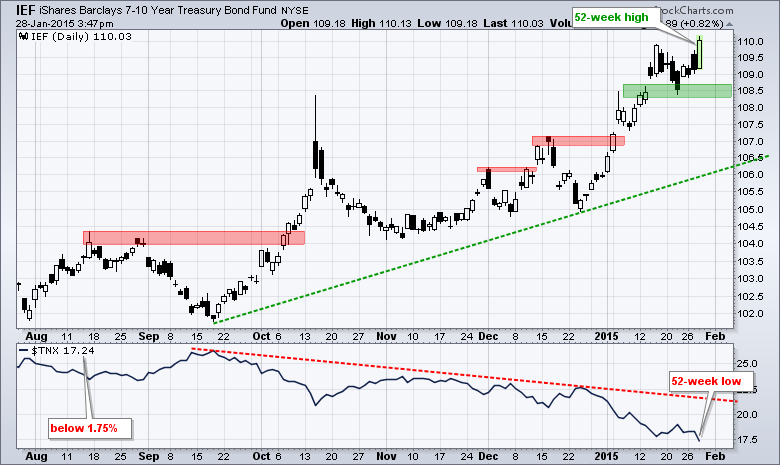
Another Fed statement has come and gone, and Treasury bonds simply continue to march higher. The chart below shows the 7-10 YR T-Bond ETF (IEF) hitting yet another 52-week high today with a big move above 110... Read More
Don't Ignore This Chart! January 27, 2015 at 10:08 AM
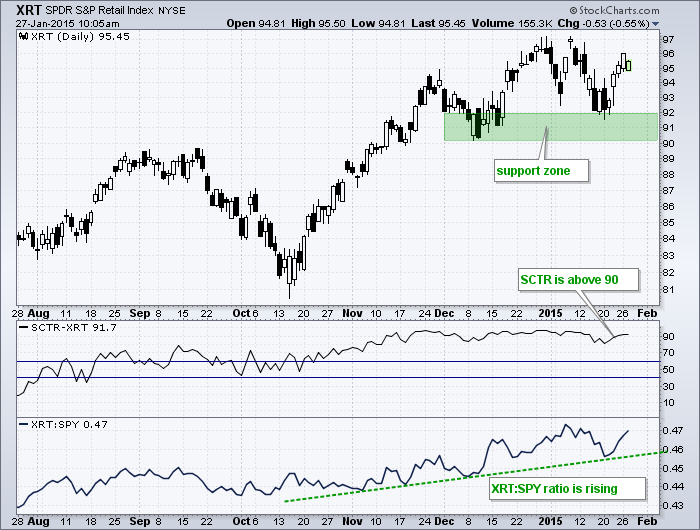
The chart below shows the Retail SPDR (XRT) bouncing off a support zone and remaining in an uptrend. For relative strength, the first indicator window shows the StockCharts Technical Rank (SCTR) above 90, which means XRT is in the top 10% of our ETF universe... Read More
Don't Ignore This Chart! January 26, 2015 at 04:10 PM
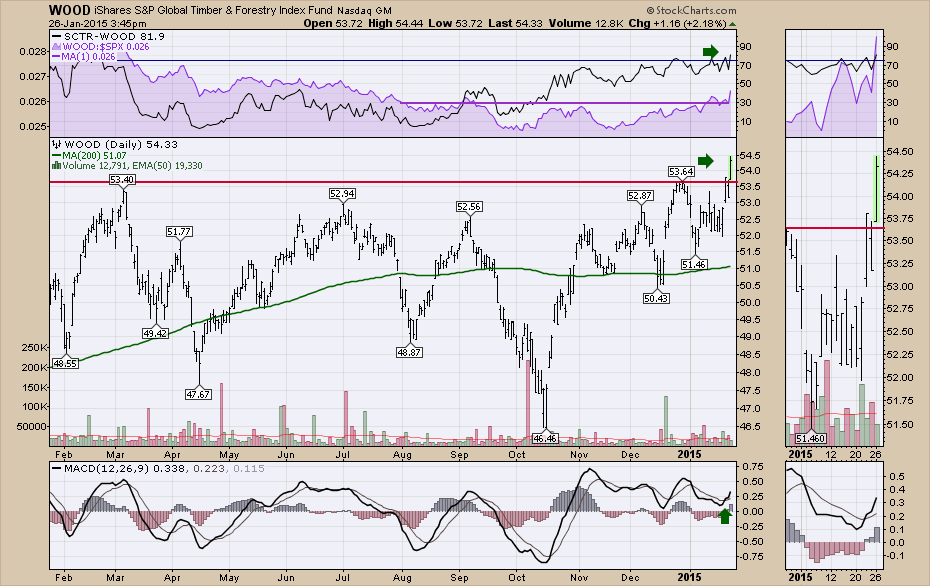
The iShares Lumber Related ETF (WOOD) has been stuck in a wide trading acreage for the better part of a year. Today it made a decisive move to the upside. Today it was the tallest twig on the chart... Read More
Don't Ignore This Chart! January 23, 2015 at 11:30 AM
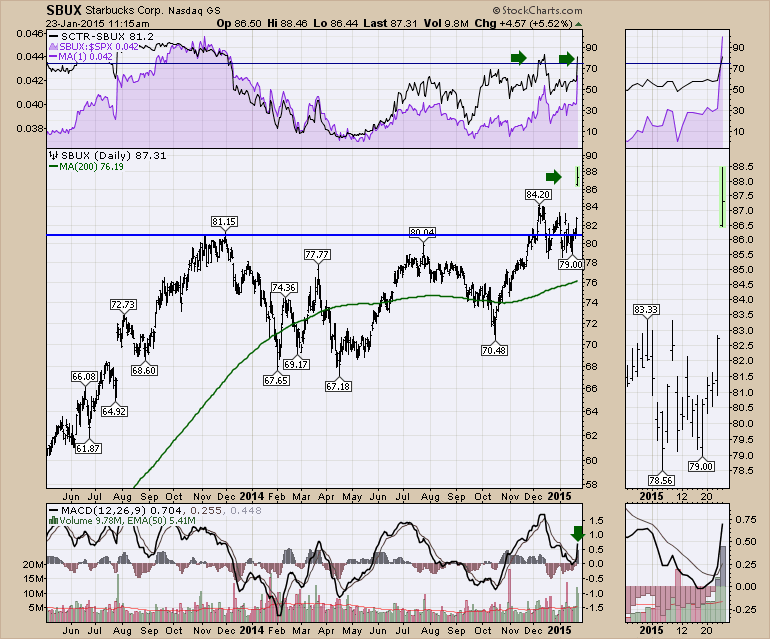
Starbucks (SBUX) reported earnings yesterday. The earnings were good but the power in the stock move was based on the earnings call. Howard Schultz, Chief Barista for the investors brew, was glowing about the opportunities in Asia. Here is the chart... Read More
Don't Ignore This Chart! January 22, 2015 at 02:25 PM
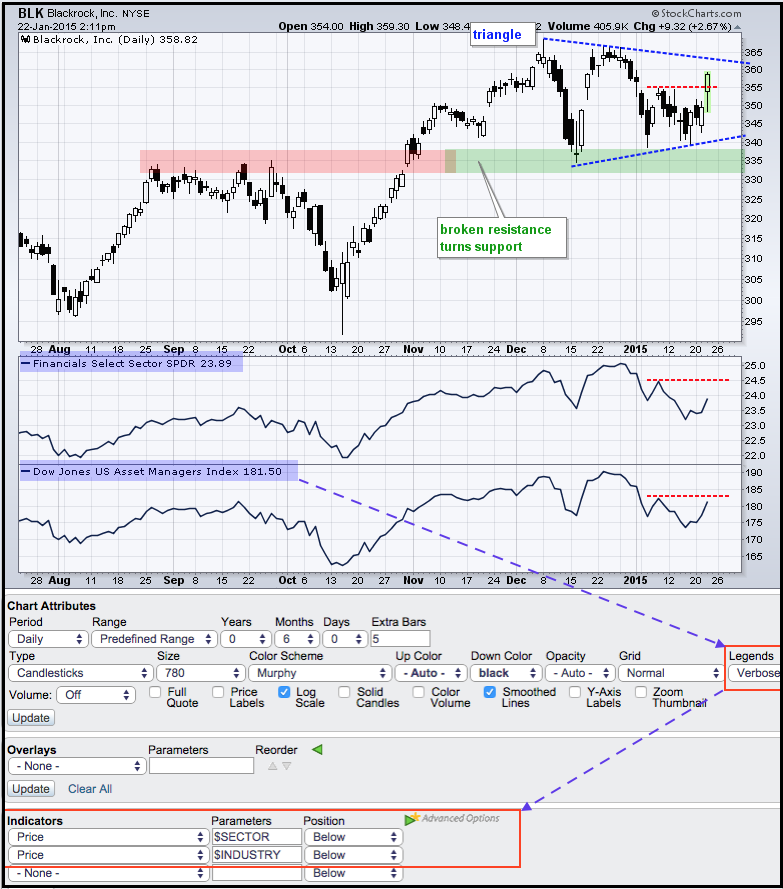
The finance sector came to life on Thursday with leadership from banks ($DJUSBK) and asset managers ($DJUSAG). The chart below shows asset manager Blackrock holding its breakout and surging off support with a big move above 355... Read More
Don't Ignore This Chart! January 21, 2015 at 03:06 PM
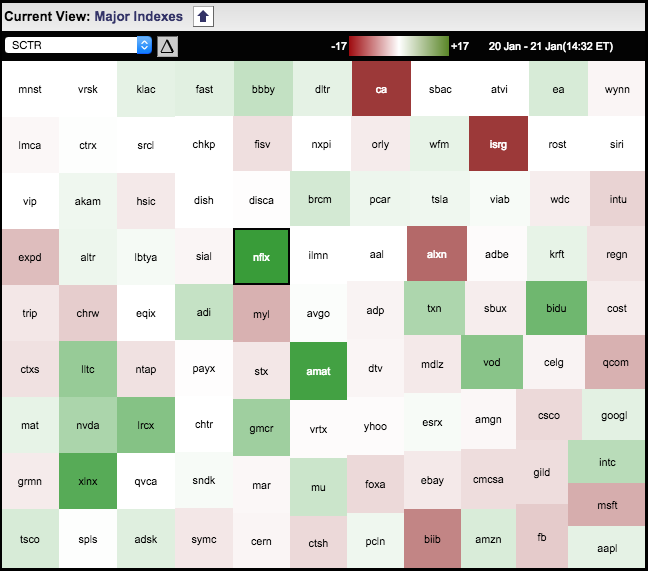
The image below comes from a MarketCarpet for the Nasdaq 100. It is set to show the biggest changes in the StockCharts Technical Rank (SCTR). The biggest gainers have dark green boxes and the biggest losers have dark red boxes... Read More
Don't Ignore This Chart! January 20, 2015 at 04:28 PM
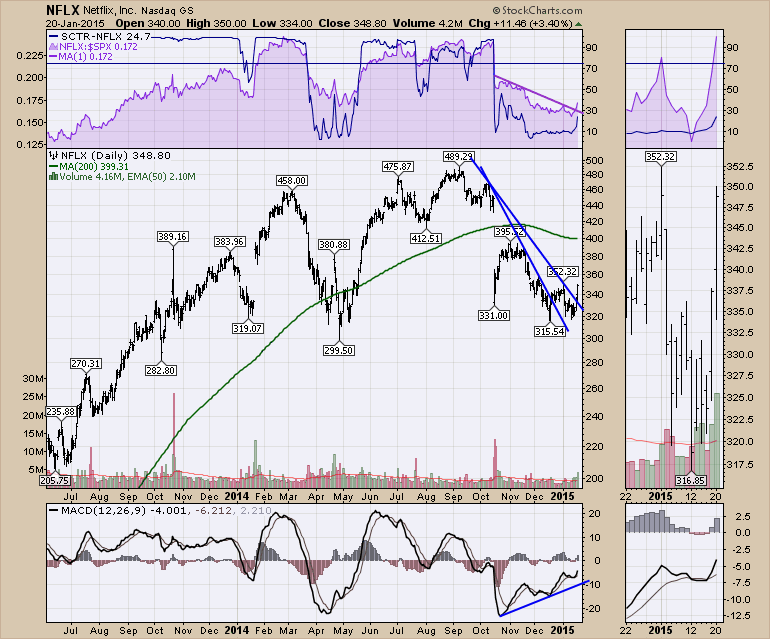
Netflix (NFLX) has introduced the world to the easiest way to spend a day watching a series of shows one after the other. It is remarkable how a technology can change a behaviour of adults so fast... Read More
Don't Ignore This Chart! January 20, 2015 at 01:41 AM
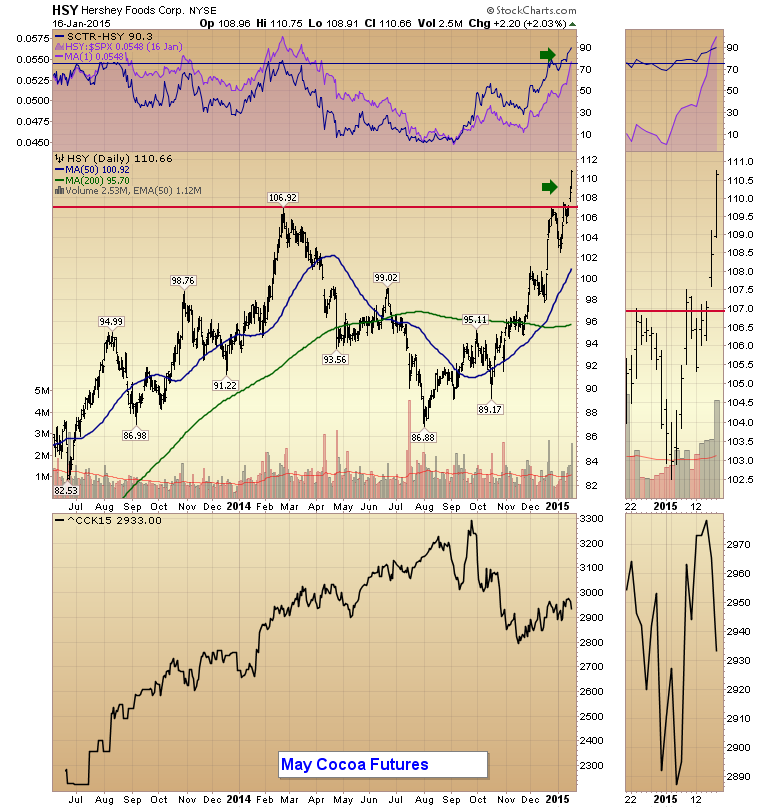
As we head into Valentine's day, Hershey's breaks out. It has had a smooth climb for a while now. This is part of Consumer Staples. As a defensive sector, we can see the growth in the stock price since the October lows... Read More
Don't Ignore This Chart! January 16, 2015 at 01:39 PM
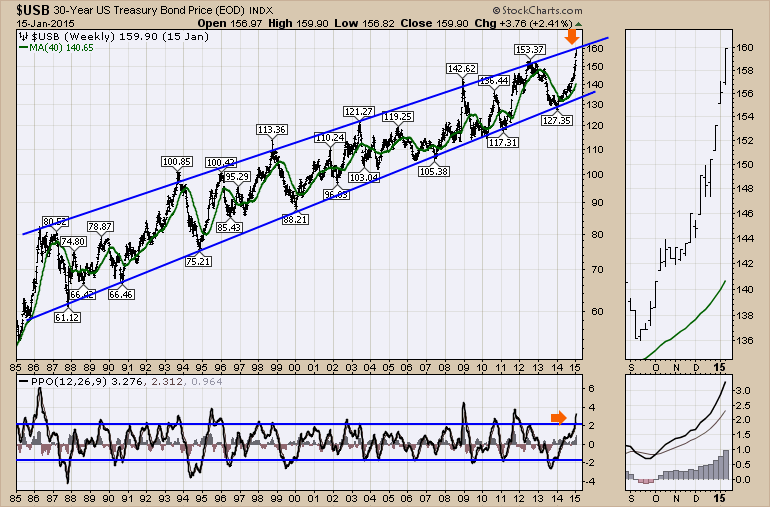
It has been a huge move on the $USB from one end of the spectrum to the other. It was a year ago that we discussed getting long the TLT which represents the long bond. With the extreme move over the last three weeks, we have reached the upper trend line... Read More
Don't Ignore This Chart! January 15, 2015 at 04:47 PM
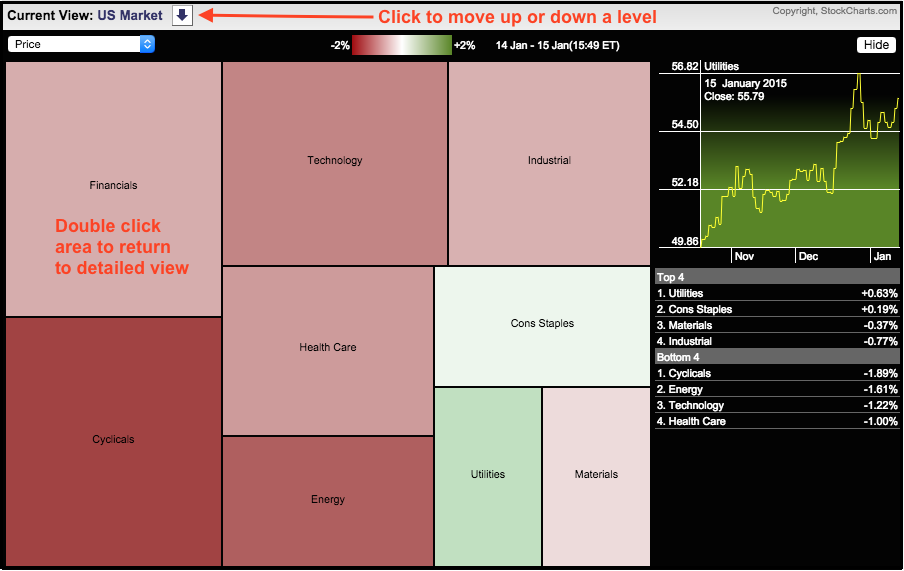
The Sector MarketCarpet shows serious selling pressure in the consumer discretionary (cyclical), energy and technology sectors on Thursday because they are the deepest red. In contrast, the utilities sector is bright green because utility stocks advanced as money sought yield... Read More
Don't Ignore This Chart! January 13, 2015 at 03:25 PM
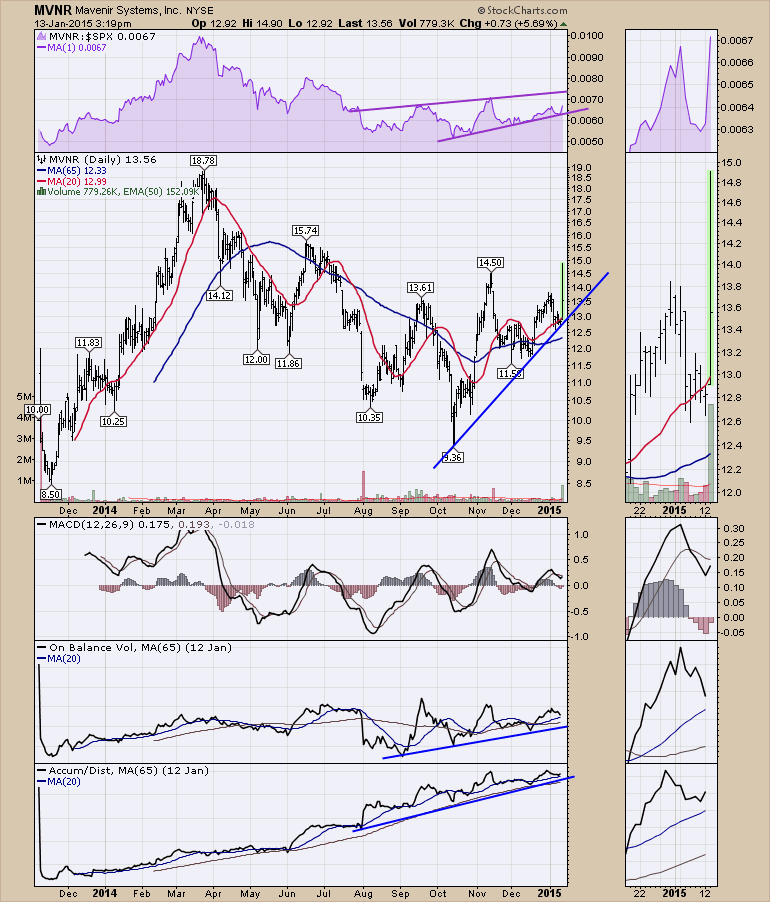
Mavenir Systems (MVNR) announced an acquisition today. The volume absolutely soared on the stock and the price broke to new highs. With the huge intra day range on the stock, it also mirrored the huge volatility of the day in the market. Mavenir IPO'd in November 2014... Read More
Don't Ignore This Chart! January 12, 2015 at 07:55 AM
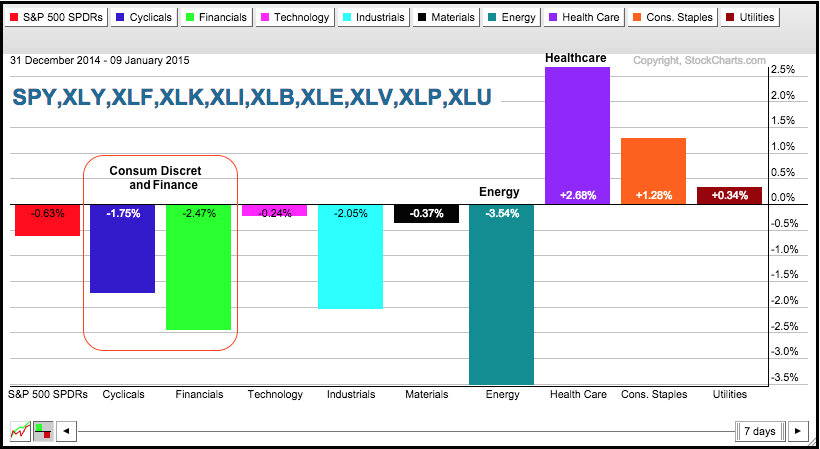
The sector PerfChart shows year-to-date performance for the nine sector SPDRs and SPY. Three sectors are up, six are down and SPY is down fractionally. The HealthCare SPDR (XLV) was the second best performing sector in 2014 and it is the best performing sector so far this year... Read More
Don't Ignore This Chart! January 09, 2015 at 09:37 PM

One of the great additions to StockCharts in 2014 was the RRG Charts. They help us visualize an entire group of stocks relative to the $SPX or whatever indicator you choose to compare to. When everything is pointing to the top right, the industry group is in an uptrend... Read More
Don't Ignore This Chart! January 09, 2015 at 10:14 AM
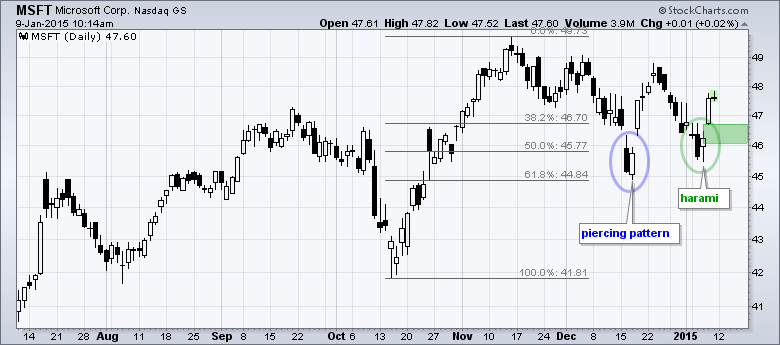
Microsoft (MSFT) sprang to life with a harami on Tuesday-Wednesday and a gap up on Thursday. This gap confirmed the harami and should be considered bullish as long as it holds. A move back below 46 would fill the gap and negate this reversal... Read More
Don't Ignore This Chart! January 08, 2015 at 02:37 PM
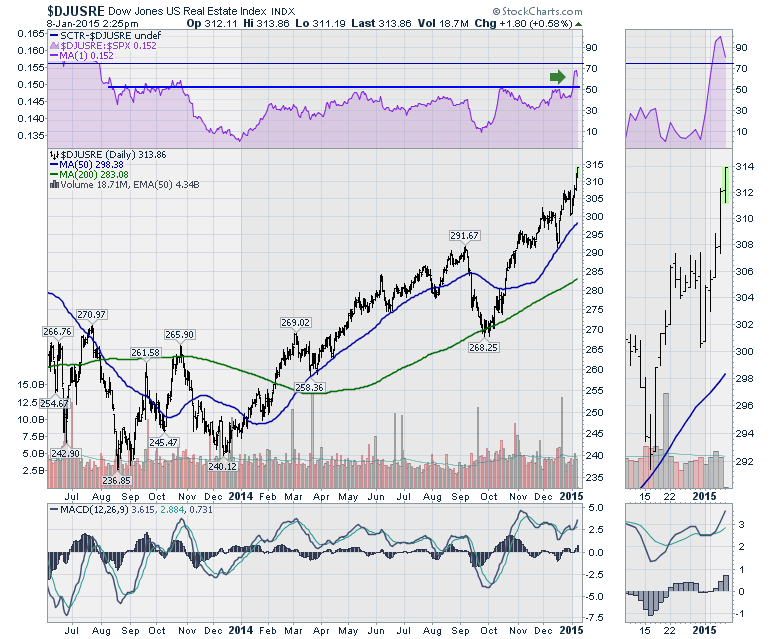
The Real Estate industry group ($DJUSRE) has been running up in tandem with the S&P 500 ($SPX). However, since the first of the year it has started to outperform the $SPX. This past week has seen the REITs and property managers moving up... Read More
Don't Ignore This Chart! January 07, 2015 at 10:33 AM
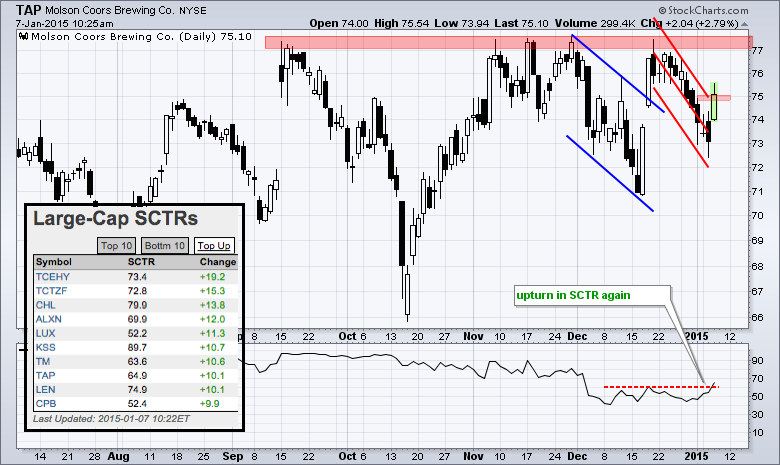
StockCharts users can view the StockCharts Technical Rank (SCTR) tables on the home page and even focus on the big movers by clicking the "top up" tab. I noticed Molson Coors (TAP) with a big move and interesting chart... Read More
Don't Ignore This Chart! January 06, 2015 at 10:30 AM
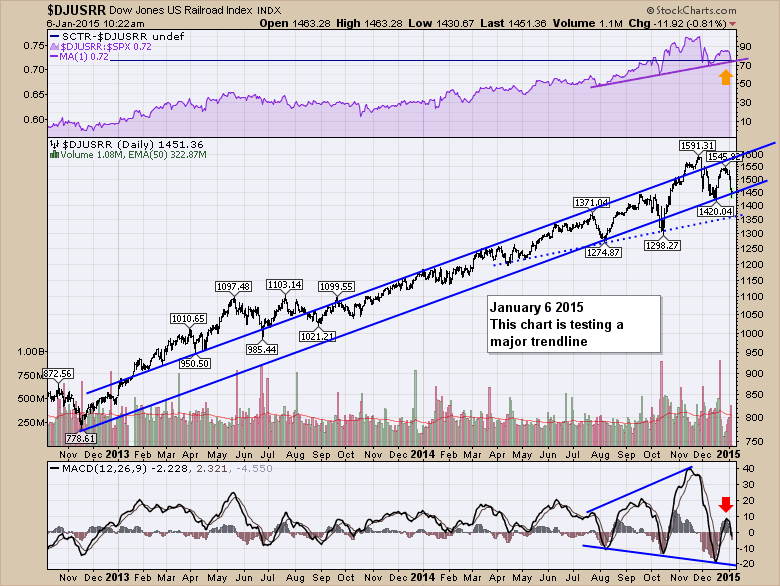
I have been watching the rails as an industry that has business cycles. Even 20 years ago, the rails were very cyclical. With the volume of oil slowing dramatically after everyone has ordered rail tankers this looks problematic... Read More
Don't Ignore This Chart! January 05, 2015 at 06:51 PM
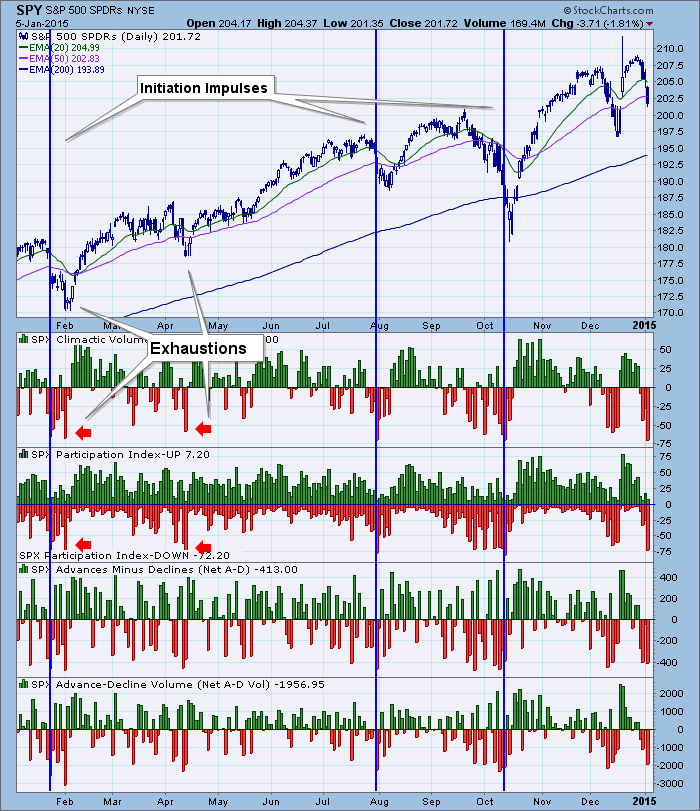
The DecisionPoint ultra-short-term indicator suite consists of the Climactic Volume Indicator (CVI), Participation Index (PI) and Net Breadth Indicators. This indicator set exploded with very negative climactic readings today... Read More
Don't Ignore This Chart! January 02, 2015 at 05:54 AM
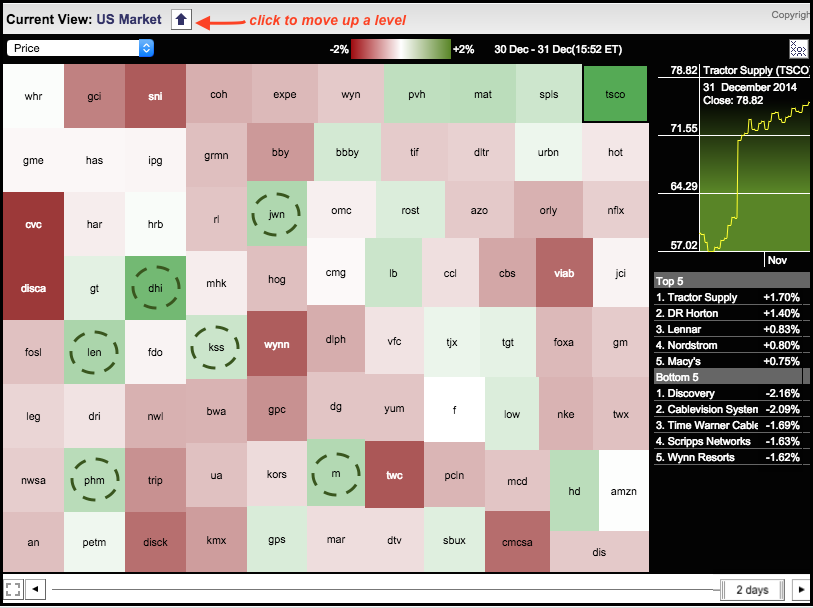
The S&P 500 took a dip on the last trading day of 2014, but several home construction and retail stocks bucked the selling pressure. Chartists can easily separate the winners and losers using the Sector Market Carpet... Read More