Don't Ignore This Chart! September 30, 2016 at 09:34 AM
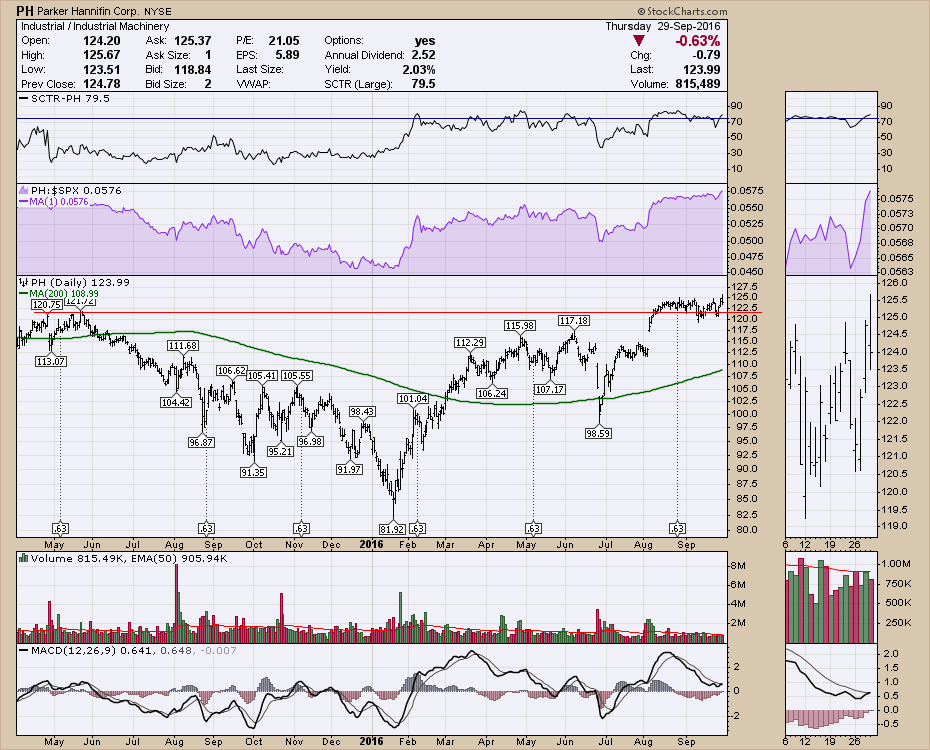
Parker-Hannifin (PH) is one of America's great industrial companies. The chart looks great too. The SCTR has transitioned from staying below 50 to staying above 50 for most of the last 8 months... Read More
Don't Ignore This Chart! September 29, 2016 at 10:36 AM
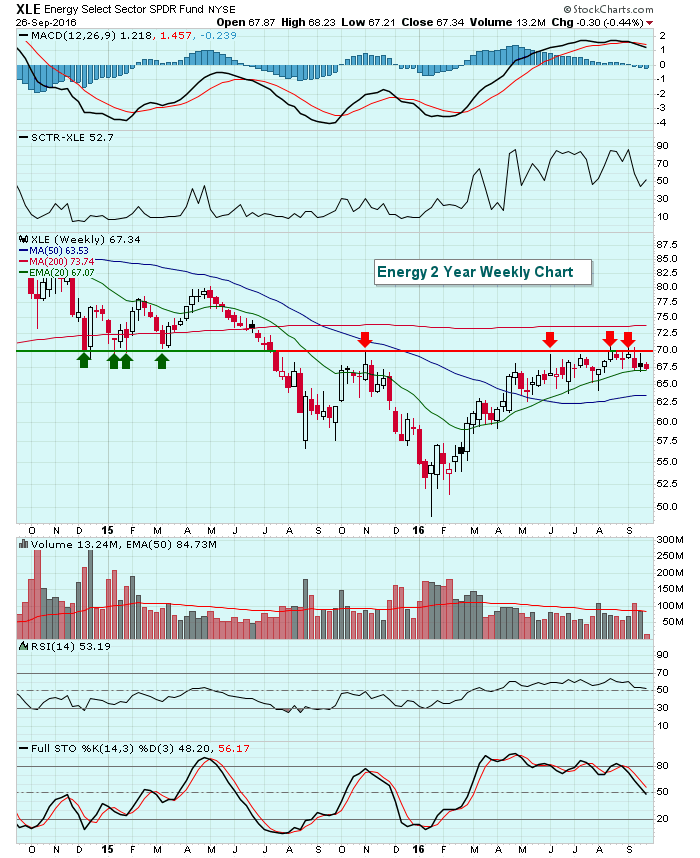
Energy stocks (XLE) have been lifted the past couple days due to OPEC agreeing to stem production in an attempt to balance supply and demand. It's difficult to say whether it'll actually work, but thus far the stock market likes what it's hearing... Read More
Don't Ignore This Chart! September 28, 2016 at 11:43 AM
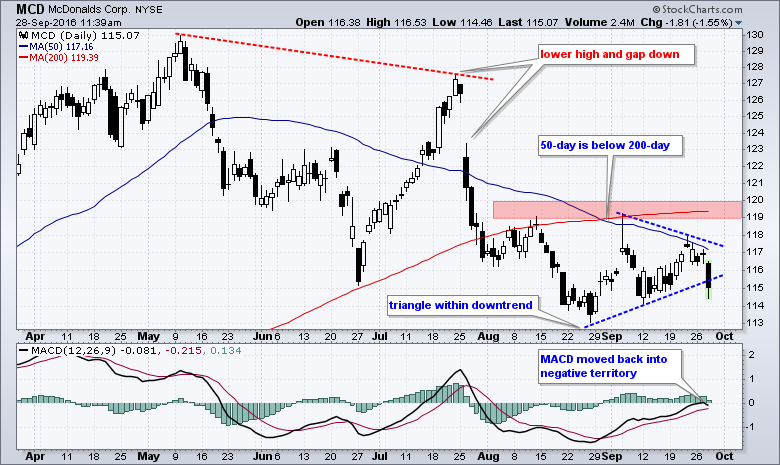
McDonalds shareholders are certainly not "lovin it" right now because the stock is in a long-term downtrend and it is one of the worst performing stocks in the Dow Industrials. The chart below shows the 50-day SMA below the 200-day SMA and the stock below the 200-day SMA... Read More
Don't Ignore This Chart! September 27, 2016 at 01:15 AM
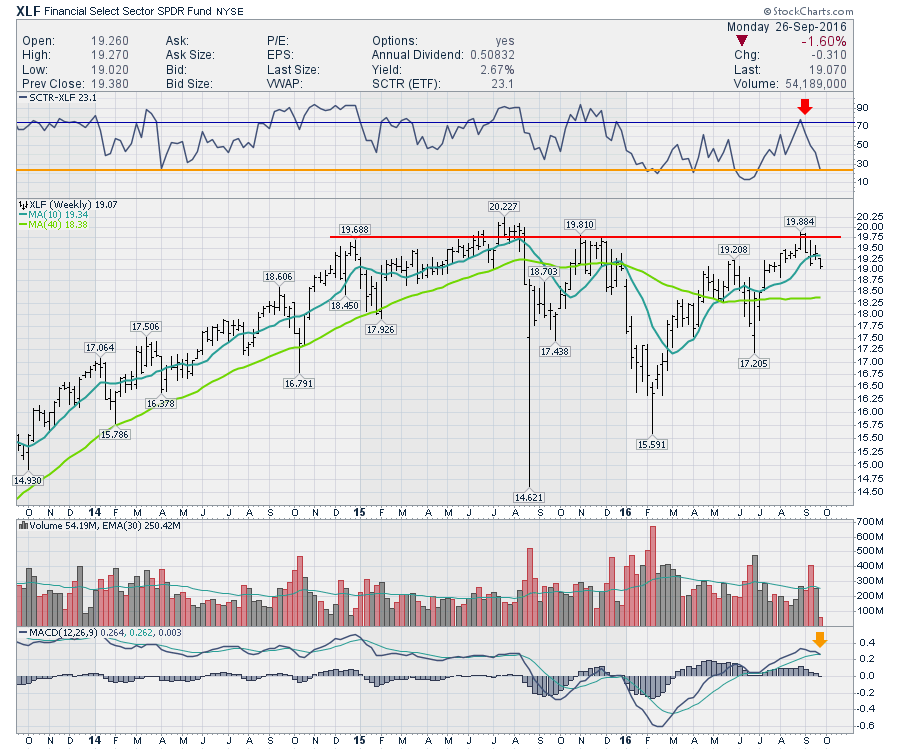
The news of Deutsche Bank (DB) breaking well below the Brexit lows can not be comforting for the broader financial community. Today the XLF lost its momentum and dropped to the bottom quadrant. While this is a weekly chart, the first day of the week sent a chilly message... Read More
Don't Ignore This Chart! September 26, 2016 at 07:39 PM
Crude oil prices ($WTIC) have been hovering between $40-$52 per barrel for the past six months, but the bottoming reverse head & shoulders pattern is telling us to watch closely to see if we can get a confirming breakout on this pattern above neckline resistance at $52... Read More
Don't Ignore This Chart! September 23, 2016 at 10:26 AM
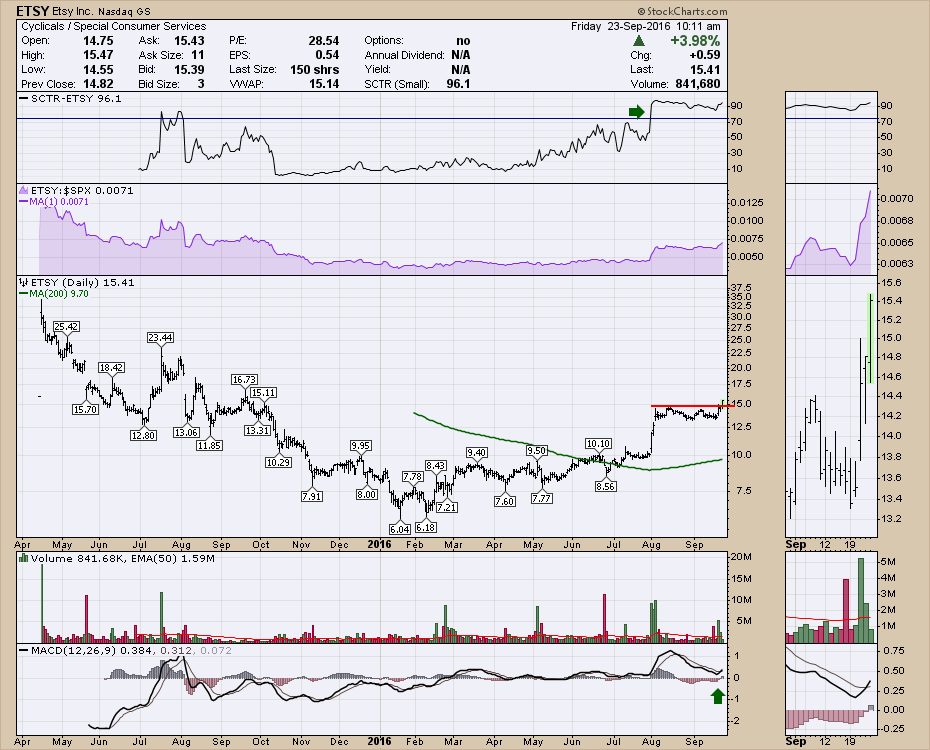
Etsy.com (ETSY) is a website focused on the craft community. This user community is a large group with very unique and creative products. As a retailing website, ETSY is bringing craft providers to craft buyers. Etsy went public in April 2015... Read More
Don't Ignore This Chart! September 22, 2016 at 03:55 PM
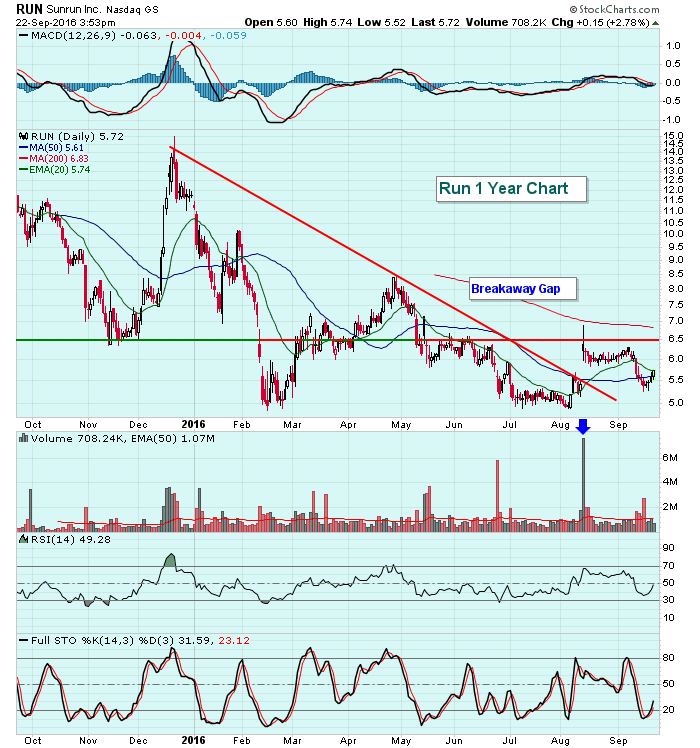
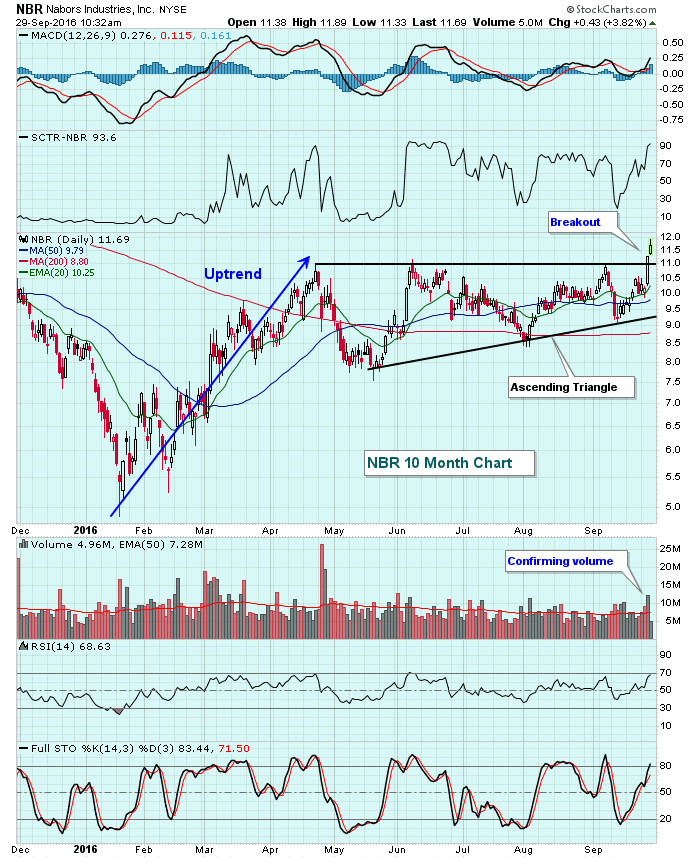
It's nice to see a heavy volume gap higher to break a downtrend. It can be a very strong signal that sentiment has changed on a particular stock or industry group... Read More
Don't Ignore This Chart! September 21, 2016 at 01:21 PM
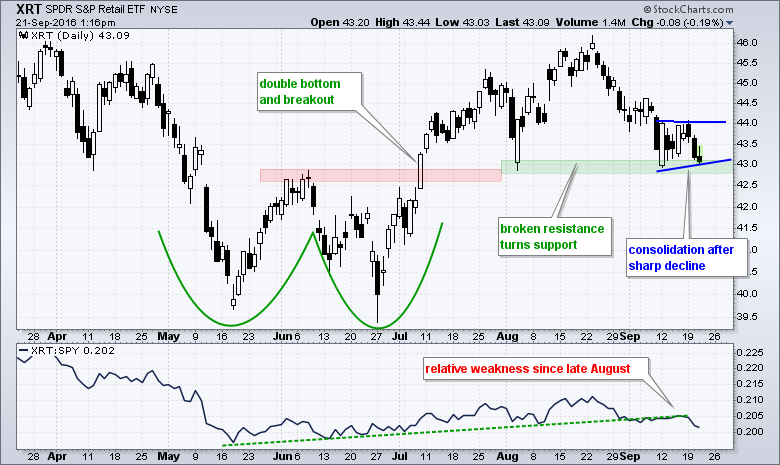
The Retail SPDR (XRT) is at its moment-of-truth with a long-term bullish pattern battling a short-term bearish pattern. Long-term, the ETF formed a double bottom and broke resistance with the July surge... Read More
Don't Ignore This Chart! September 20, 2016 at 06:00 PM
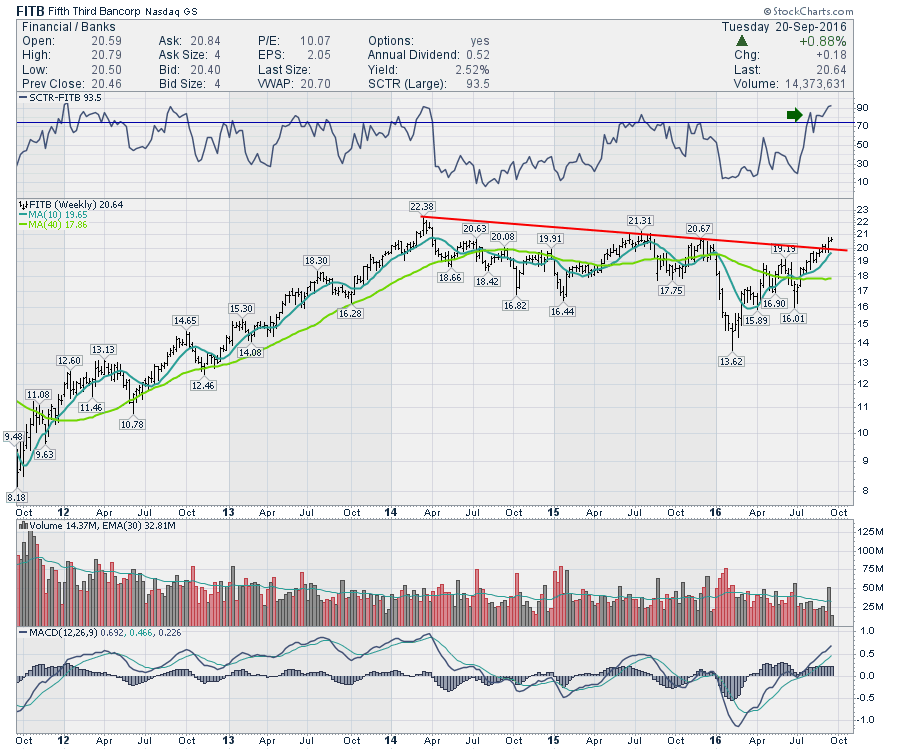
Fifth Third (FITB) is a bank with an upward bias above the previous peaks. After spending almost 2.5 years building a ceiling on the stock, FITB is finally pushing through. The SCTR started pushing up above 75 back in July. Last week was the break above the trend line... Read More
Don't Ignore This Chart! September 19, 2016 at 11:51 AM
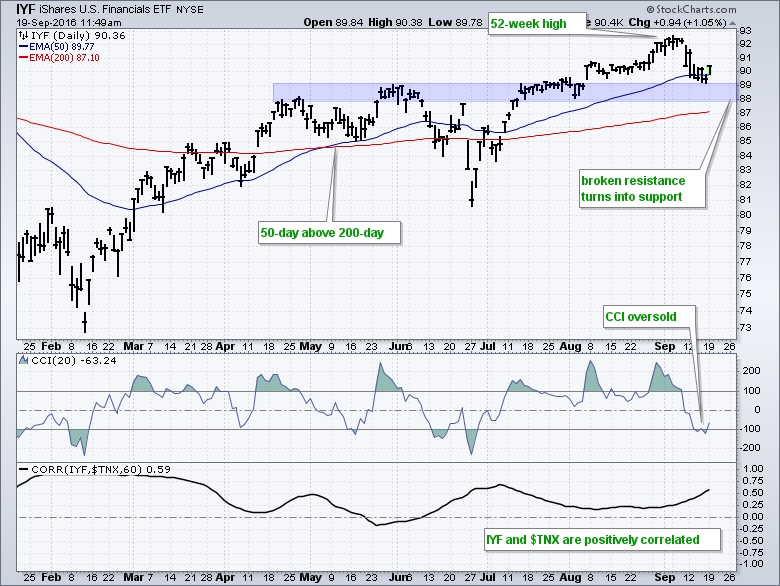
Chartists looking to track the finance sector can turn to the iShares Financials ETF (IYF). Note that the Finance SPDR (XLF) is in the midst of a metamorphosis this week so chartists can consider watching IYF for clues on the finance sector this week... Read More
Don't Ignore This Chart! September 17, 2016 at 11:40 AM
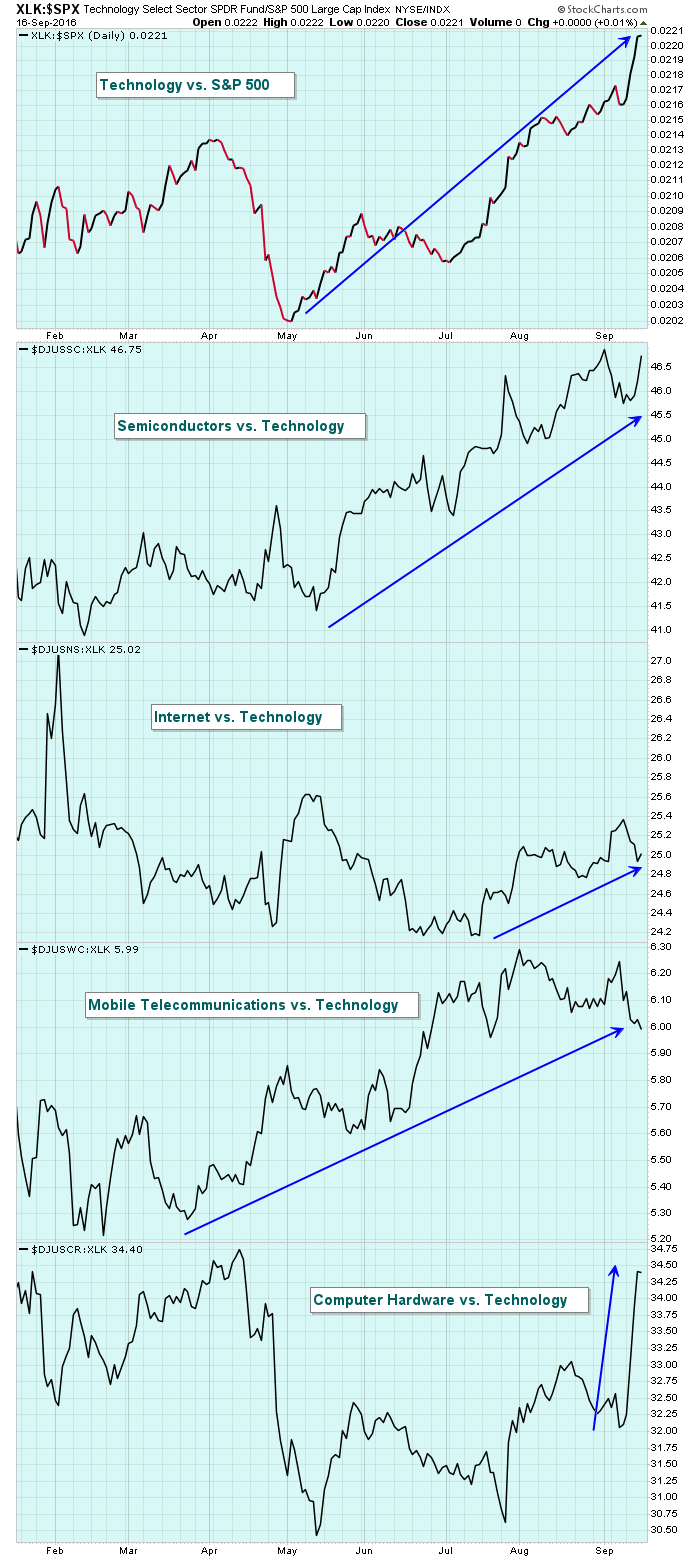
After technology stocks (XLK, +2.70%) clubbed the energy sector (XLE, -2.64%) last week, the former group is now the leading sector over the past six months, widely outperforming the benchmark S&P 500 index... Read More
Don't Ignore This Chart! September 16, 2016 at 09:39 PM
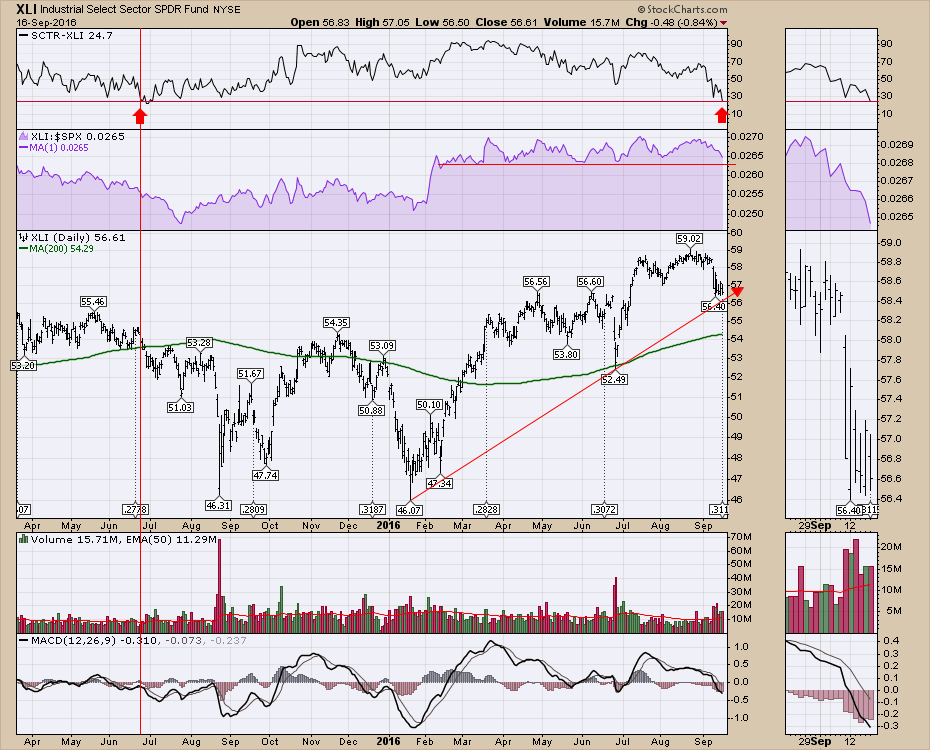
The Industrial Sector (XLI) SCTR has gone from top to bottom in the last few months. One of the reasons this is a little concerning is when the SCTR for the XLI dropped into the bottom quadrant in 2015, it marked a 6-month struggle for the index and the sector... Read More
Don't Ignore This Chart! September 15, 2016 at 06:12 PM
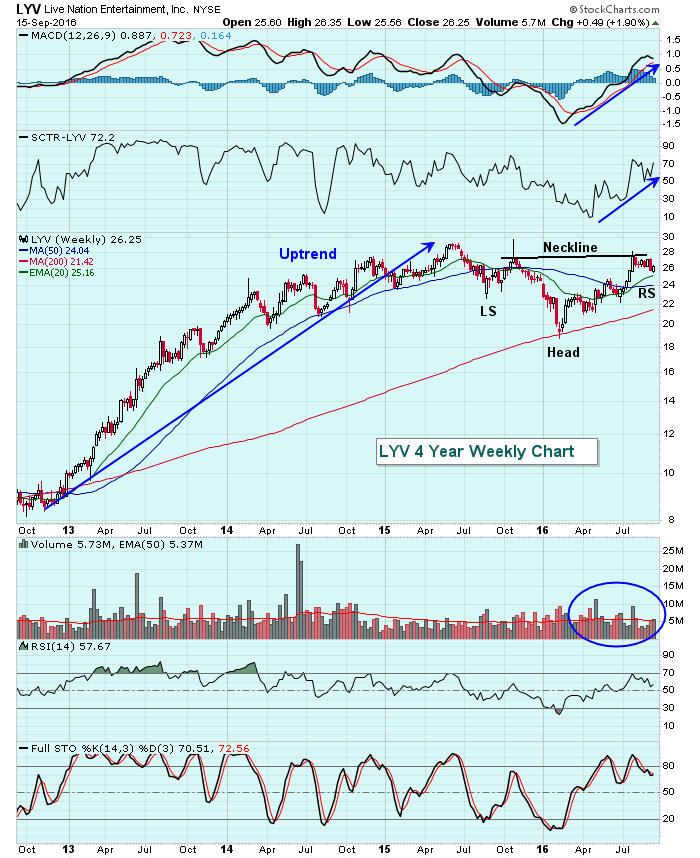
Live Nation Entertainment (LYV) is a $5 billion consumer discretionary company that in late July reported excellent quarterly results and gapped higher to touch the 28.00 level. The stock's all-time high came in October 2015 just beneath 30.00... Read More
Don't Ignore This Chart! September 14, 2016 at 05:38 PM
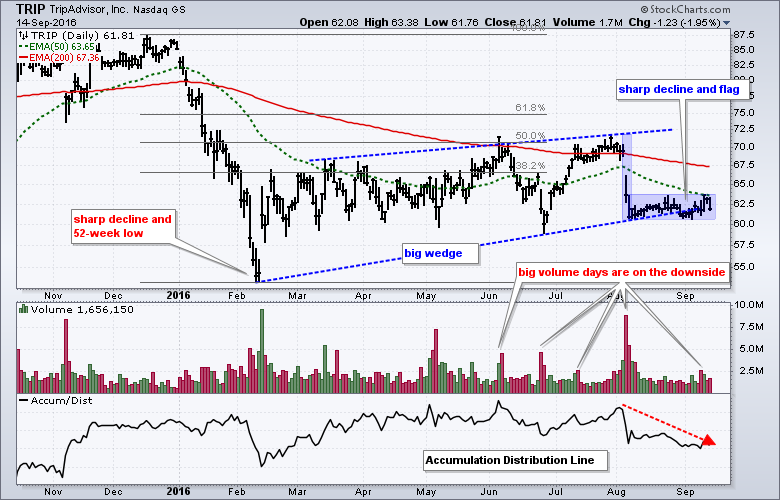
The chart for TripAdvisor (TRIP) shows bearish patterns on two different timeframes and the stock looks poised for a breakdown. First, note that the long-term trend is down because the 50-day EMA is well below the 200-day EMA... Read More
Don't Ignore This Chart! September 13, 2016 at 05:40 PM
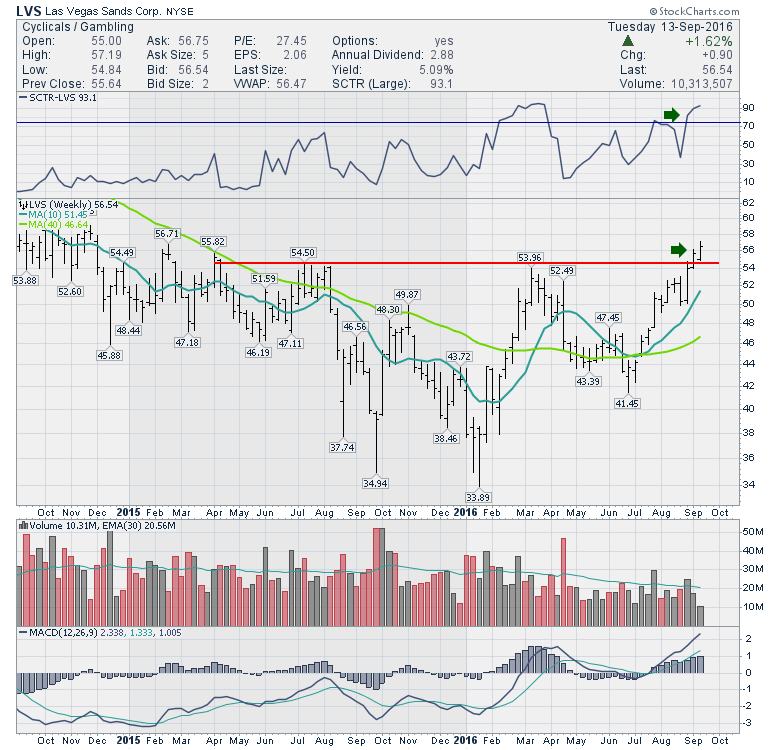
Las Vegas Sands (LVS) has been moving higher for a while. The news now is that LVS is breaking out to 52-week highs. Even more interestingly, it has been rising while the markets have been selling off the last few days... Read More
Don't Ignore This Chart! September 12, 2016 at 12:03 PM
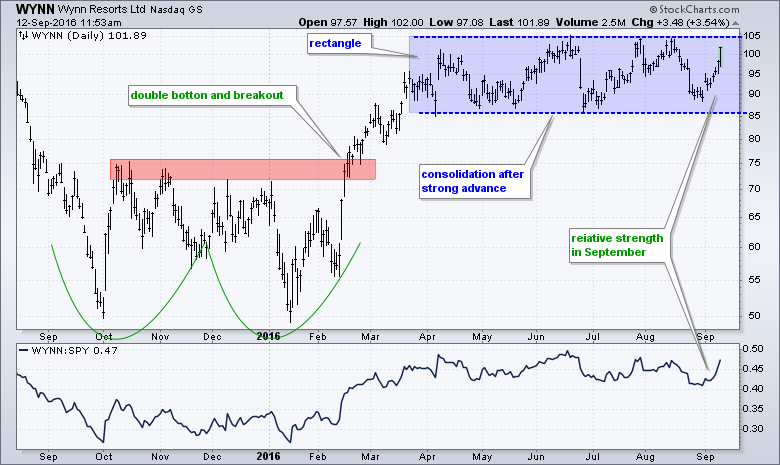
It is always interesting to find out which stocks advance when the market falls sharply, such as Friday. The S&P 500 was down over 2% with heavy selling pressure, but 11 stocks managed to buck the selling pressure and close higher on Friday... Read More
Don't Ignore This Chart! September 09, 2016 at 10:51 AM
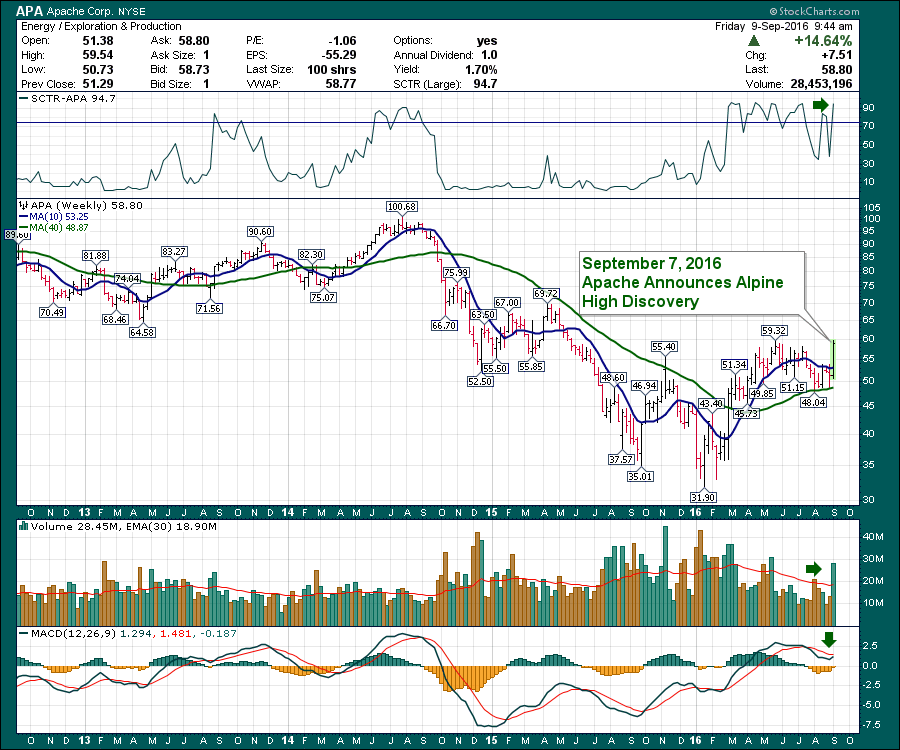
In the oil business, rarely are huge new fields found as the geophysical technology gets better and better. Usually, oil exploration companies find smaller new plays, but the large ones are pretty well mapped. Every now and then, a surprise shows up... Read More
Don't Ignore This Chart! September 08, 2016 at 10:00 AM
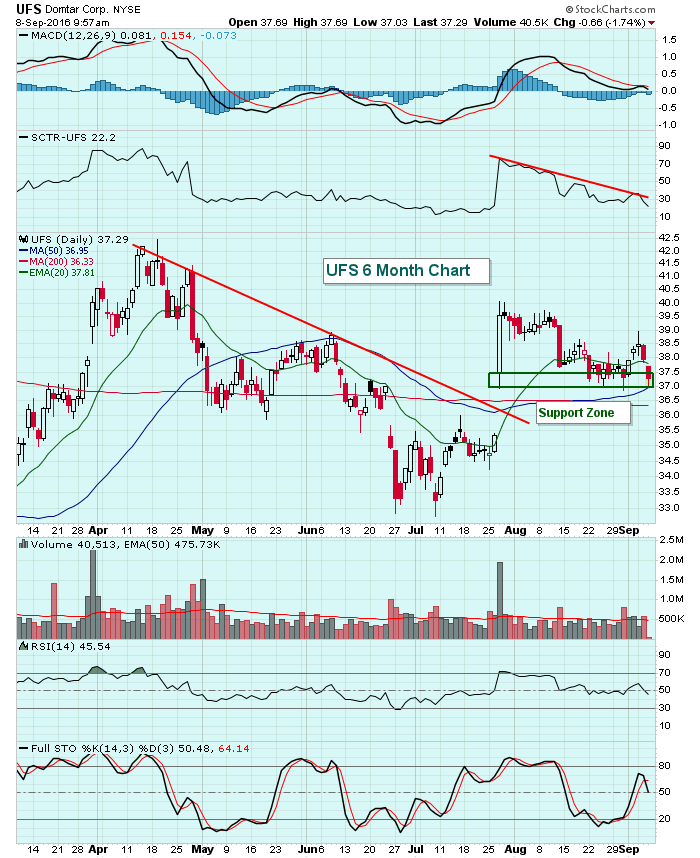
Domtar Corp (UFS) has returned to a key support zone between 37.00-37.50. A close below this level would be bearish as Domtar's longer-term chart is neutral at best. I'd be looking for the top of the earnings-related gap higher in late July to hold. That day, the open was 37... Read More
Don't Ignore This Chart! September 07, 2016 at 09:13 AM
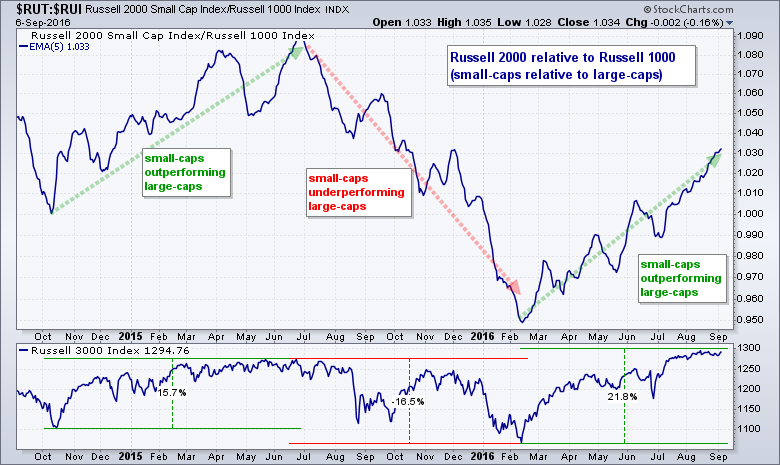
The year started weak for small-caps, but their fortunes quickly turned around in February and this group is now leading the market. The chart below shows the Russell 2000 relative to the Russell 1000 using the price relative ($RUT:$RUI ratio)... Read More
Don't Ignore This Chart! September 06, 2016 at 10:41 PM
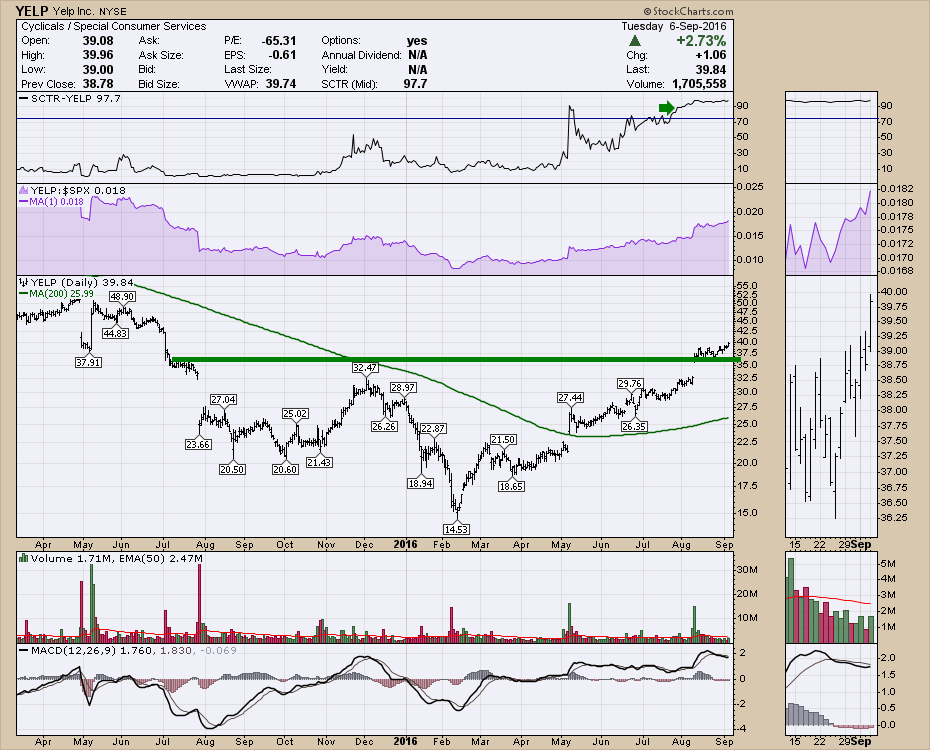
Yelp (YELP) has recovered nicely under the radar. With over 400 new highs today, YELP was in the same neighbourhood. The stock has been climbing nicely and the SCTR shows it being one of the top performers. The breadth today was big with lots of stocks participating... Read More
Don't Ignore This Chart! September 03, 2016 at 12:12 PM
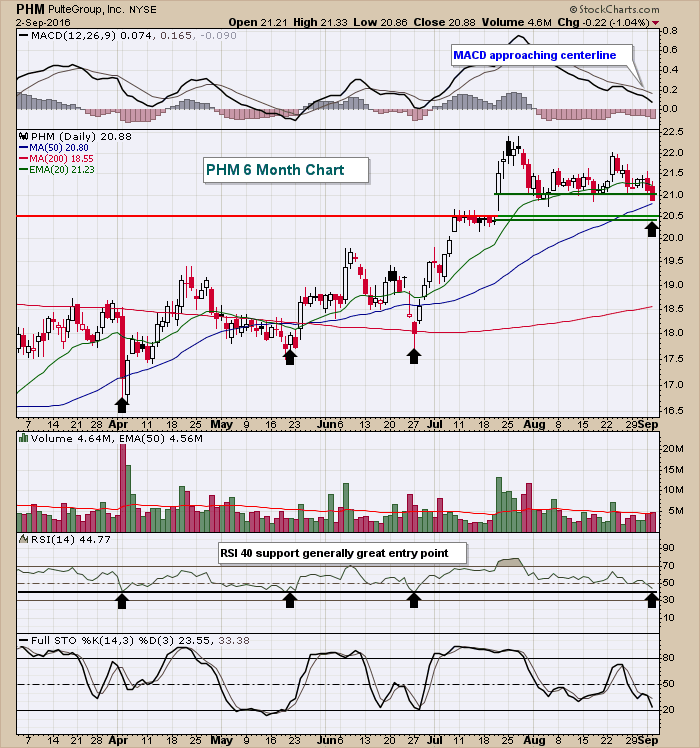
One of my favorite trades is looking for a bounce off of gap support. Many times, the top of gap support will provide great support and the stock will never "fill" the entire gap back to the prior close. PulteGroup (PHM) lost the top of its gap support at 21... Read More
Don't Ignore This Chart! September 02, 2016 at 09:26 AM
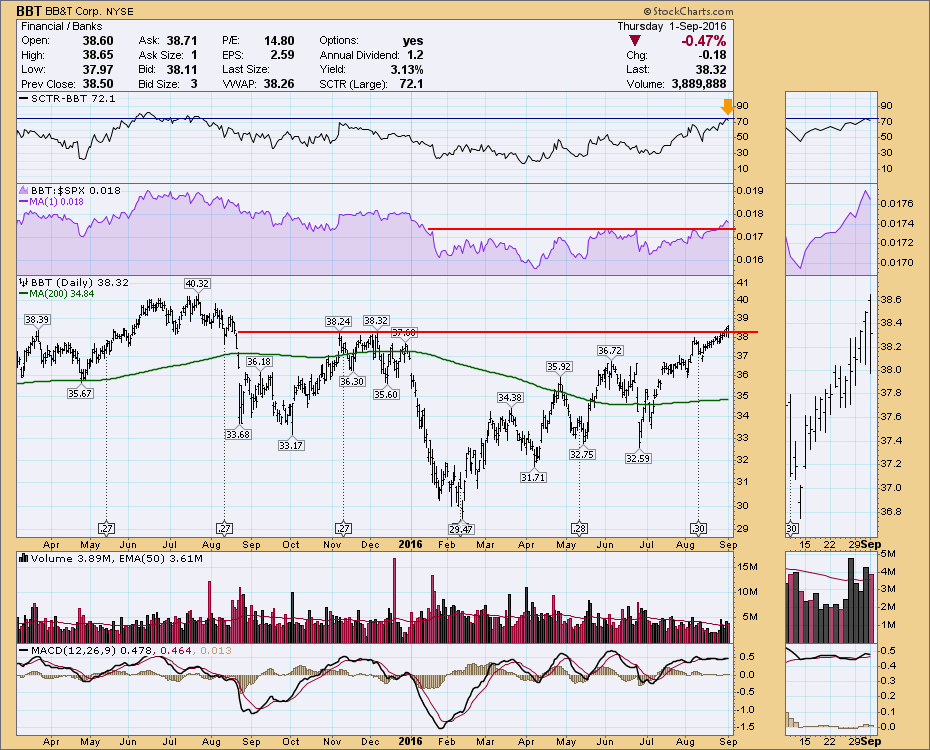
The financial charts are broadly breaking out to new 6-month highs. Some are breaking out to new annual highs like BB&T (BBT). With the SCTR trying to get above 75, this stock is starting to show leadership... Read More
Don't Ignore This Chart! September 01, 2016 at 05:06 PM
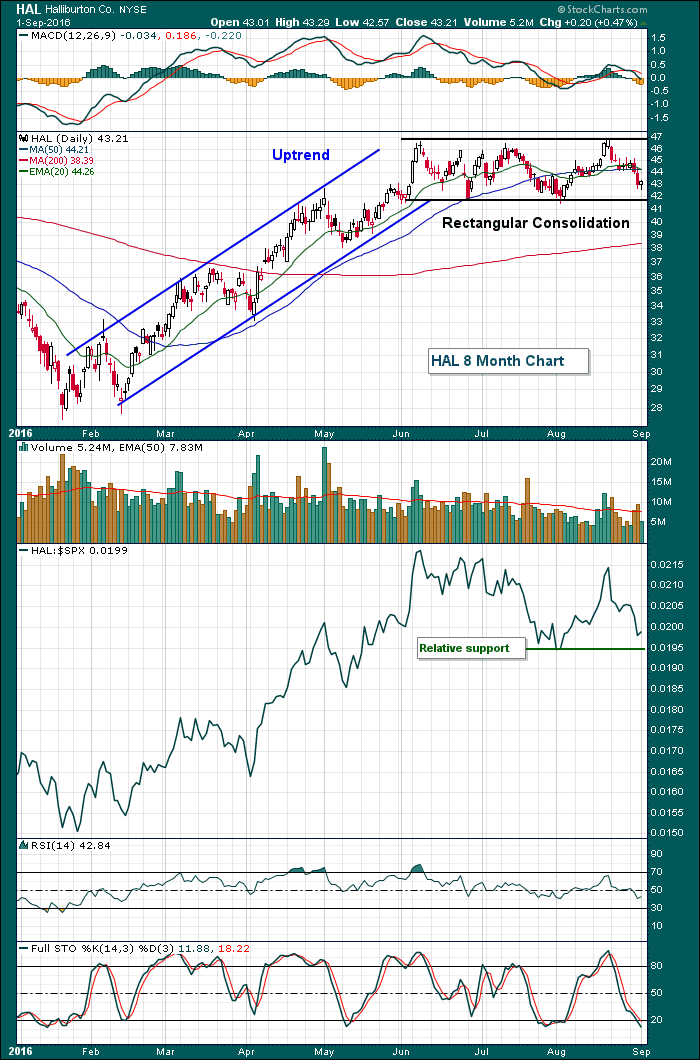
Haliburton (HAL) had risen close to 70% from its February low to its early June high, but since that time has simply consolidated those gains. Over the past two weeks, HAL has declined close to 10% and is nearing a very important short-term price support level... Read More