Don't Ignore This Chart! August 31, 2016 at 03:50 PM
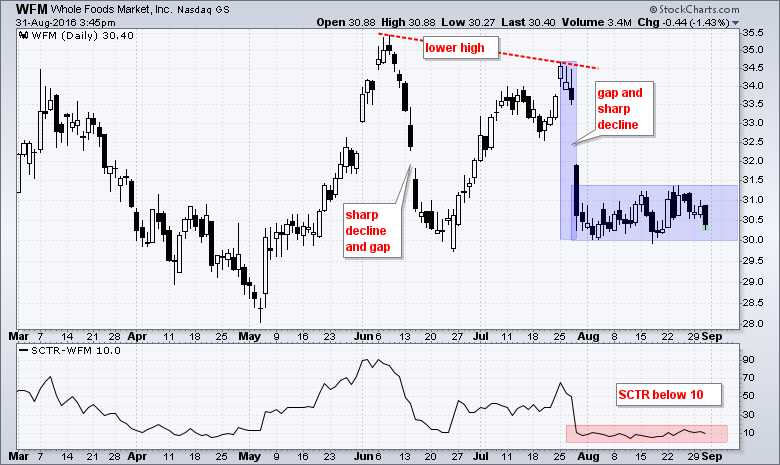
It has been a rough summer for Whole Foods Market (WFM) as the stock plunged in June and late July. Both declines were sharp and featured big gaps. The stock did bounce between the two declines, but formed a lower high in late July... Read More
Don't Ignore This Chart! August 30, 2016 at 03:38 PM
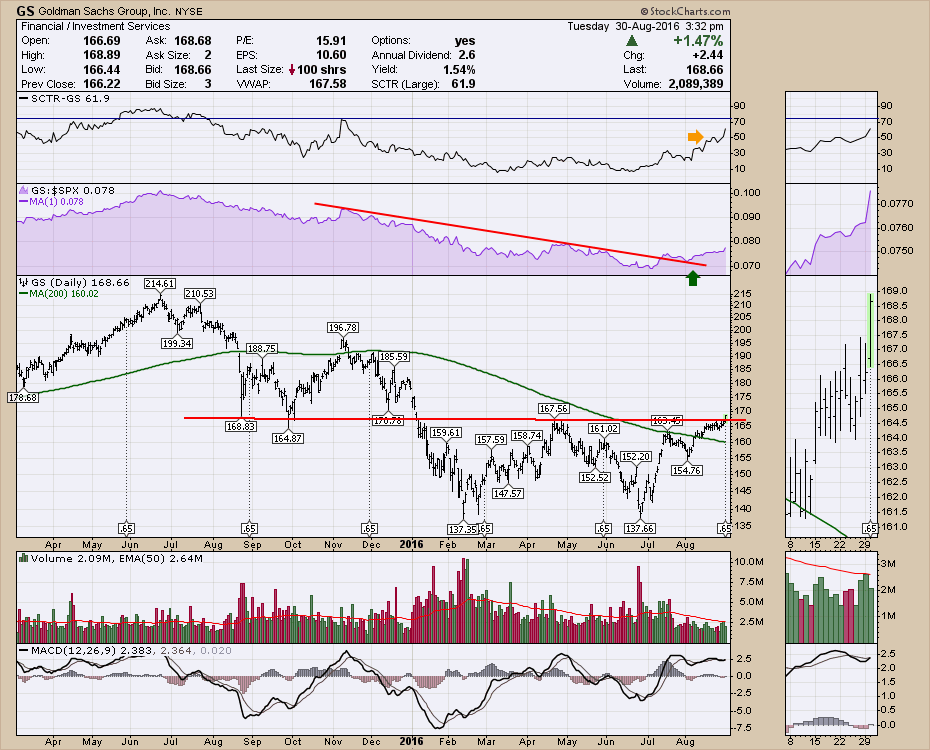
Goldman Sachs (GS) is a big name financial that broke out to new 6-month highs today. Citi (C) also broke out to new 6-month highs... Read More
Don't Ignore This Chart! August 29, 2016 at 11:32 AM
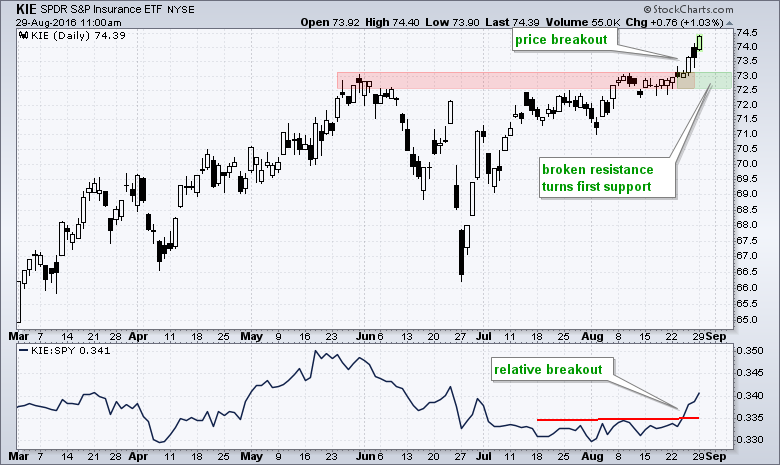
Stocks in the finance sector have been strong the last four days with the Insurance SPDR (KIE) showing chart leadership... Read More
Don't Ignore This Chart! August 27, 2016 at 09:45 AM
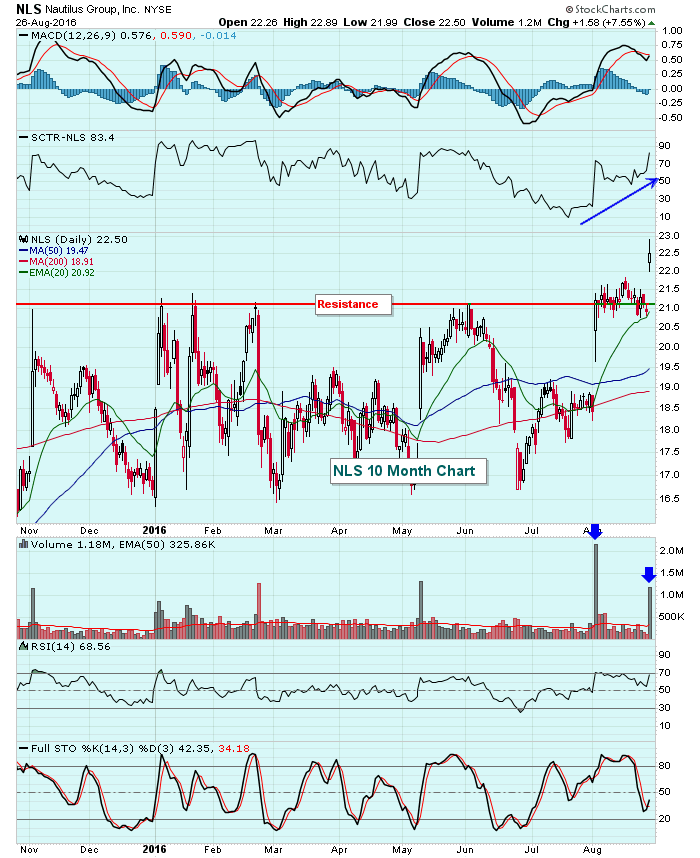
Nautilus (NLS) officially became a technical heavyweight on Friday as its stock price soared through price resistance to a fresh new 52 week high, bouncing bullishly off its rising 20 day EMA in the process... Read More
Don't Ignore This Chart! August 26, 2016 at 08:12 AM
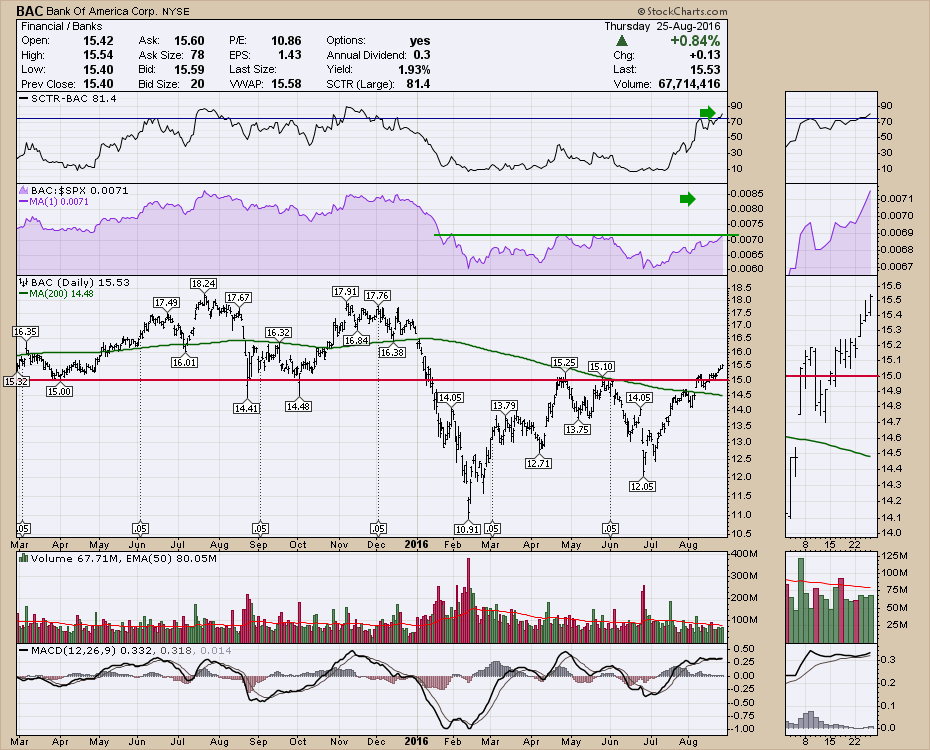
Bank Of America (BAC) has been migrating higher over the last few months off the Brexit lows. As Bank Of America approaches the highs for 2016, the chart has some interesting traits. The last time BAC got near $15, the SCTR ranking was poor, sitting around 30... Read More
Don't Ignore This Chart! August 25, 2016 at 10:57 AM
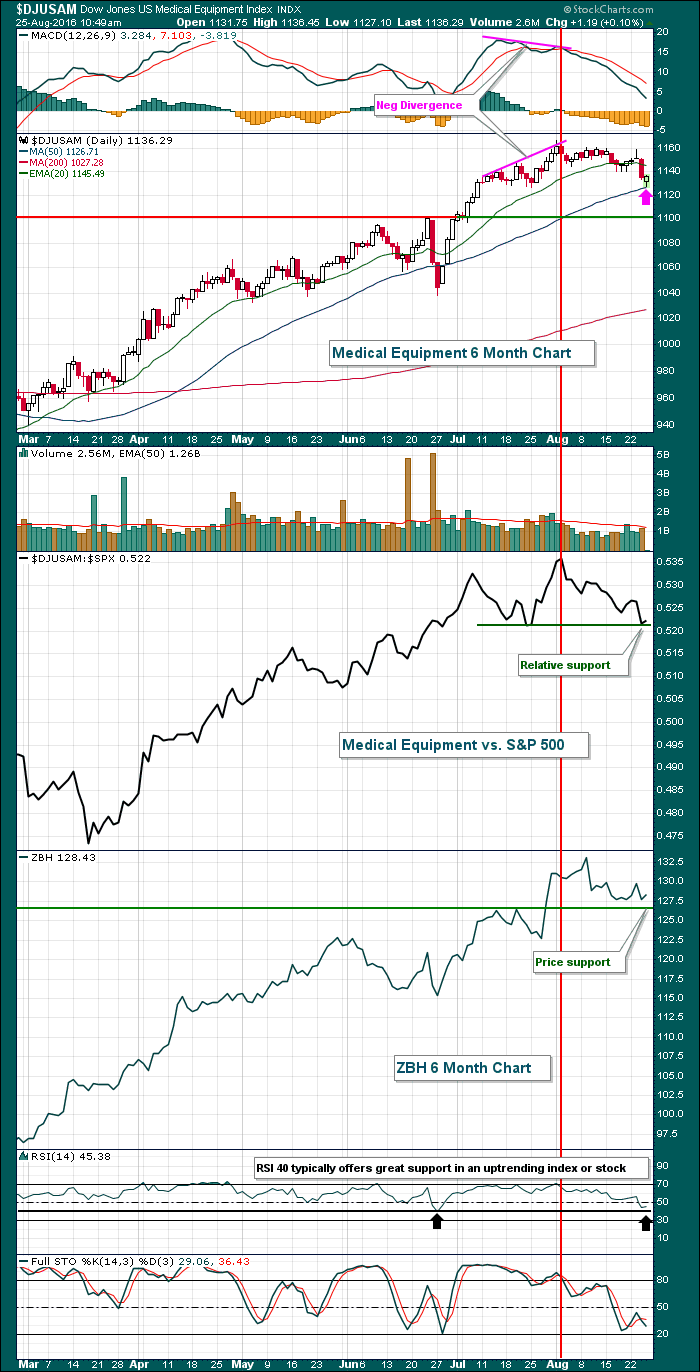
The U.S. stock market has been suffering from a series of negative divergences that have run rampant throughout many sectors and industry groups. As one weakening group sells off, money rotates to another strengthening group... Read More
Don't Ignore This Chart! August 24, 2016 at 06:08 PM
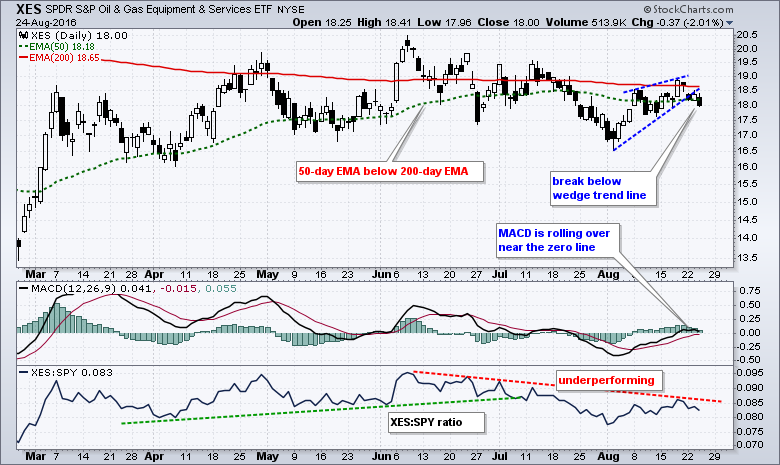
The Oil & Gas Equip & Services SPDR (XES) looks vulnerable because the bigger trend is down and the ETF just broke a wedge trend line. The chart shows the 50-day EMA (green) below the 200-day EMA (red) and this suggests that a long-term downtrend remains underway... Read More
Don't Ignore This Chart! August 23, 2016 at 11:17 AM
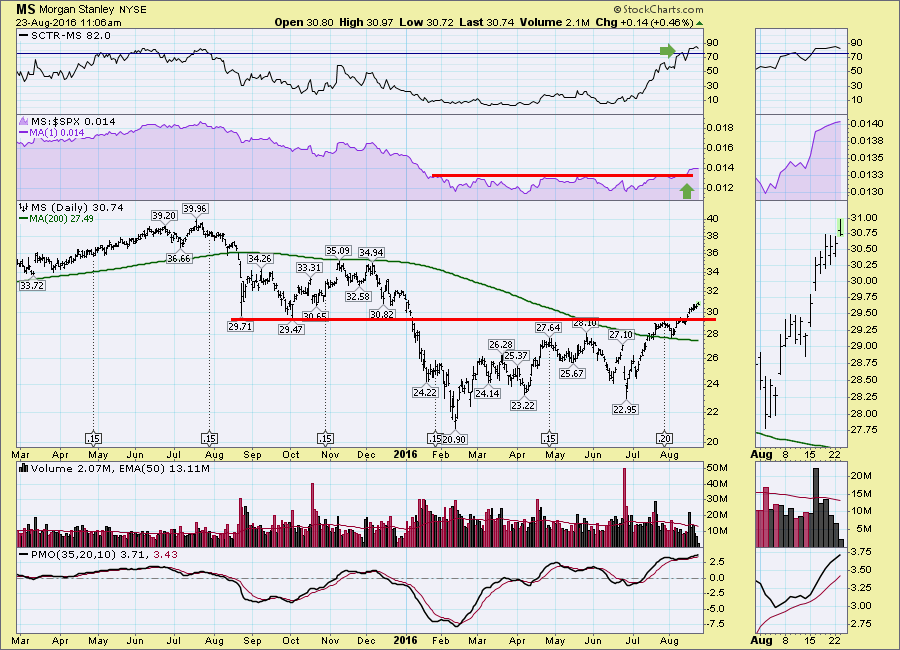
Morgan Stanley (MS) has built a nice base and has been pushing above resistance for the last week. There are a few more clues that I like on the chart... Read More
Don't Ignore This Chart! August 23, 2016 at 12:10 AM
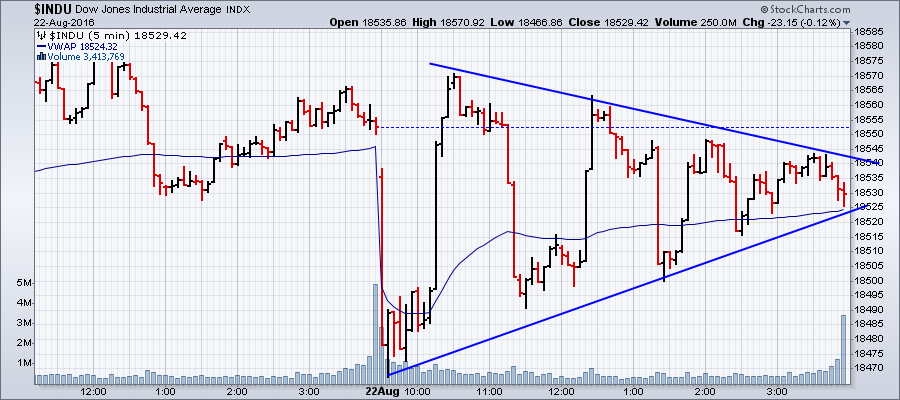
The Dow did something strange and wonderful today on its intraday chart: A perfect symmetric triangle pattern! But one with really strange jumps up and down throughout. Truly fascinating... Read More
Don't Ignore This Chart! August 22, 2016 at 05:58 PM
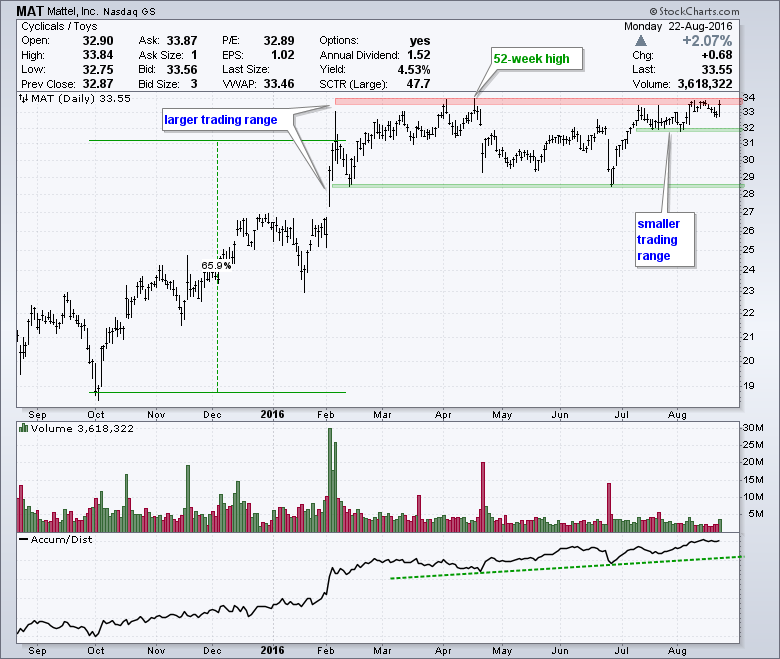
Mattel (MAT) led the market from early October to early February with a 65 percent advance and then moved into a large consolidation the last six months. More recently, the stock surged off support in late June and then formed a smaller consolidation near resistance... Read More
Don't Ignore This Chart! August 21, 2016 at 08:54 PM
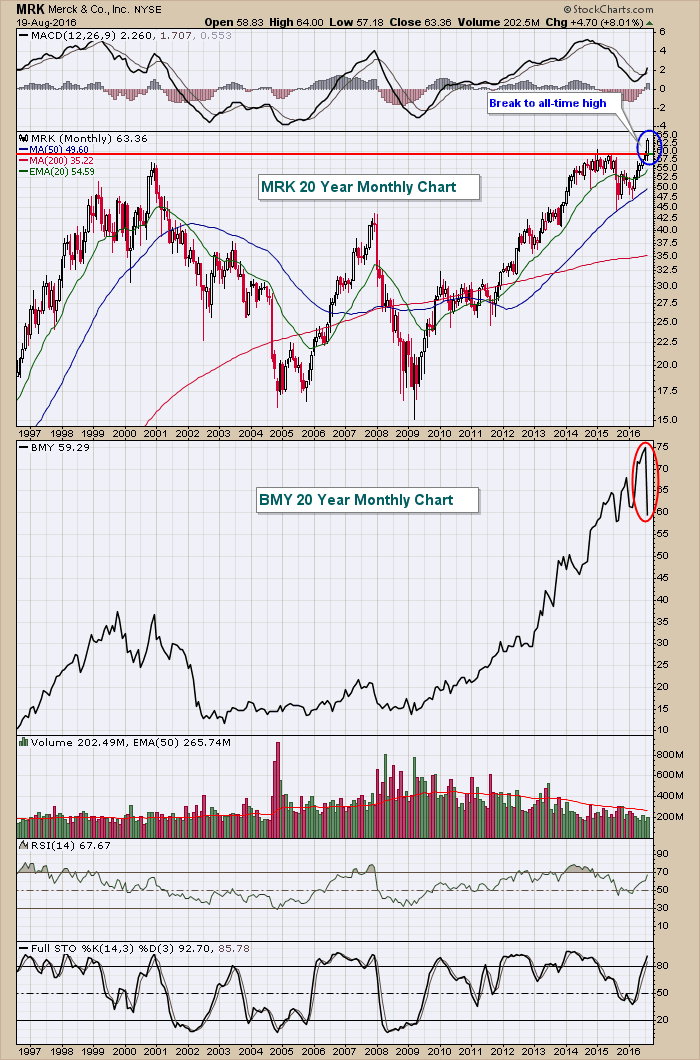
One company's failure can be another company's catalyst. Take for instance Merck & Co (MRK), who on Friday, August 5th surged to an all-time high after Bristol Myers (BMY) had a failed clinical trial of its lung cancer drug... Read More
Don't Ignore This Chart! August 19, 2016 at 11:24 AM
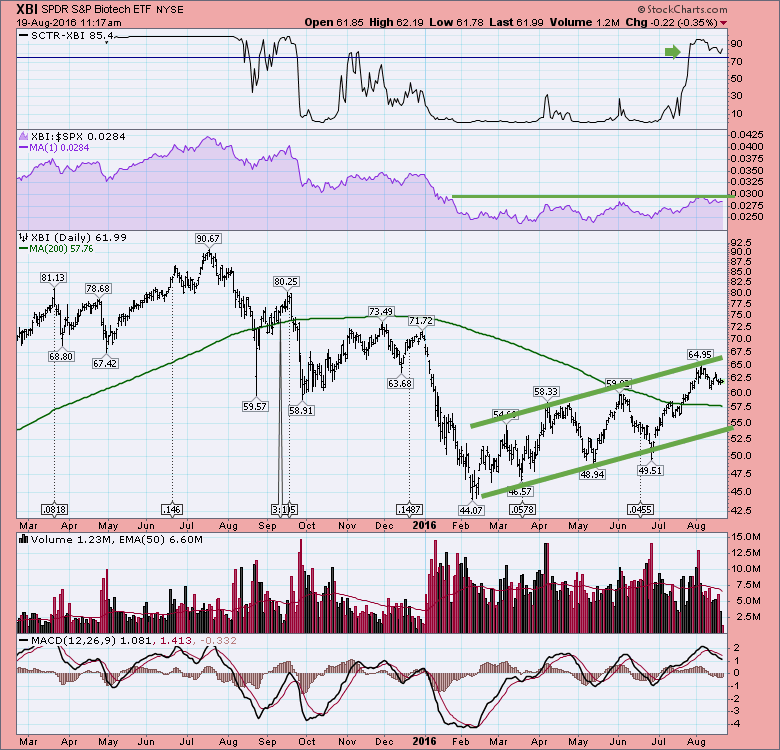
Biotech has been moving up recently as a part of this bullish trend. XBI is one of the many Biotech ETF's. The SCTR breakout is nice to see and the ETF has formed a nice up-trending channel. As more Biotechs participate, there are some fresh breakouts showing up... Read More
Don't Ignore This Chart! August 18, 2016 at 10:06 AM
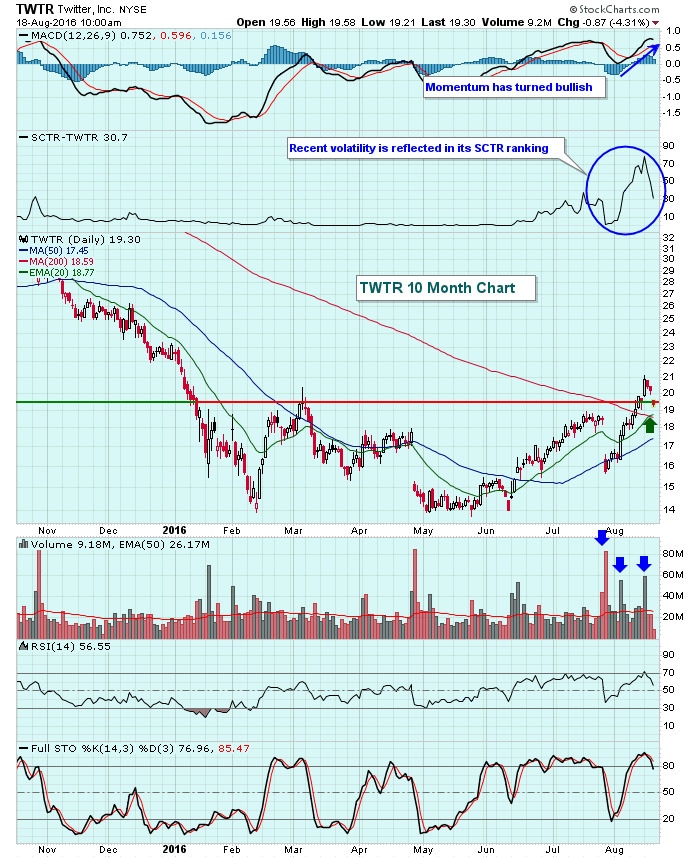
There aren't too many stocks under the same scrutiny as Twitter (TWTR) and expectations range from wildly bullish to wildly bearish... Read More
Don't Ignore This Chart! August 17, 2016 at 11:45 AM
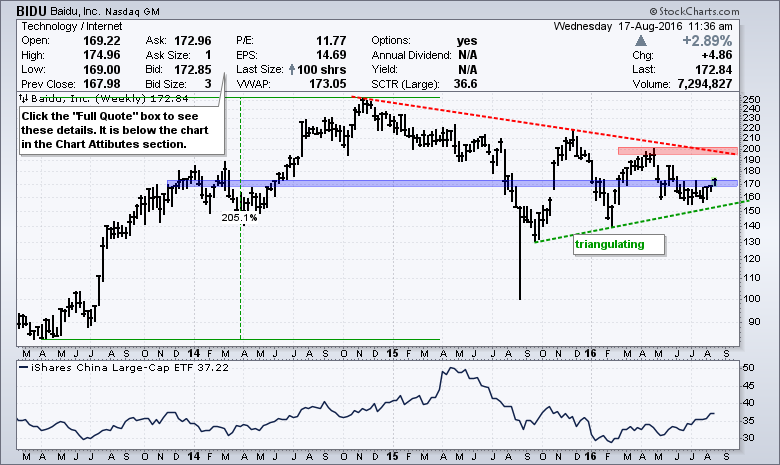
Baidu ($BIDU) has basically gone nowhere since 2014, but the stock is showing signs of buying pressure recently with a wedge breakout. First, the weekly chart shows the stock surging some 200% and moving above 170 for the first time in late 2013... Read More
Don't Ignore This Chart! August 16, 2016 at 08:00 AM
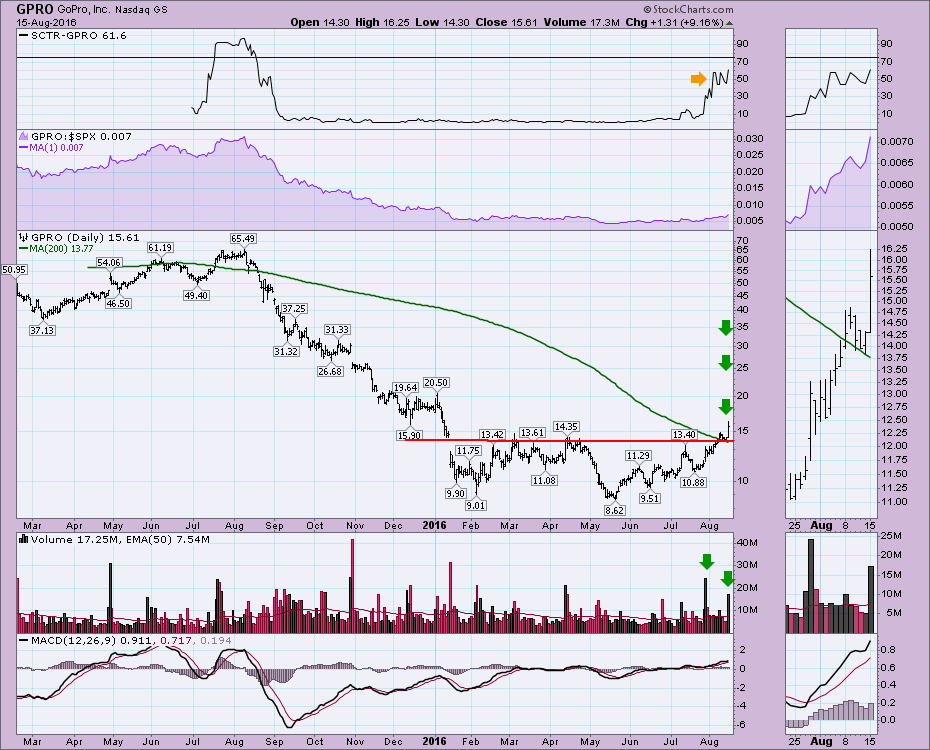
GoPro (GPRO) has been sliding in investor sentiment for a year. After falling below the 200 DMA over a year ago, GPRO continued to splash around in the dirt. Today it seems to be launching out of a base as we head towards the retail season for youth with Back to School... Read More
Don't Ignore This Chart! August 15, 2016 at 11:45 AM
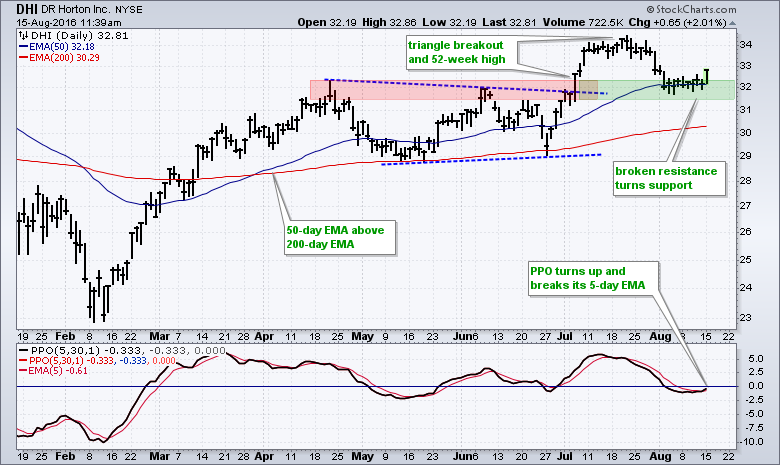
DR Horton (DHI) is part of the housing group and the stock is in a long-term uptrend. I based this trend assessment on three things. First, the 50-day EMA is above the 200-day. Second, the 200-day EMA is rising. Third, the stock hit a 52-week high in July... Read More
Don't Ignore This Chart! August 13, 2016 at 06:54 PM
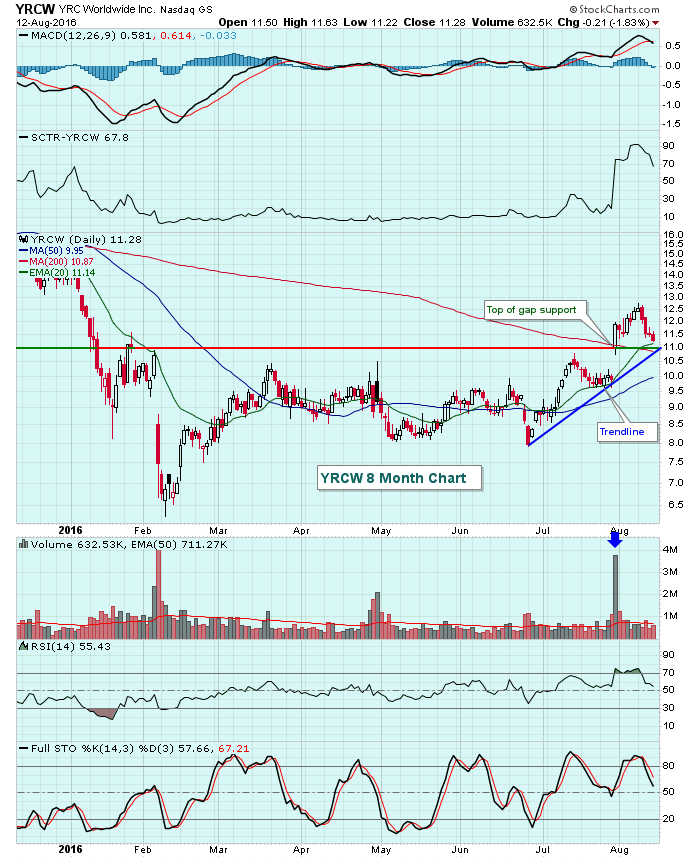
YRC Worldwide (YRCW) recently posted quarterly results that blew away Wall Street consensus estimates with EPS reported at $.83. The estimate was for just $.51. That news was well received by traders as YRCW gapped up and opened at 10.98 on July 29th and never looked back... Read More
Don't Ignore This Chart! August 12, 2016 at 03:04 PM
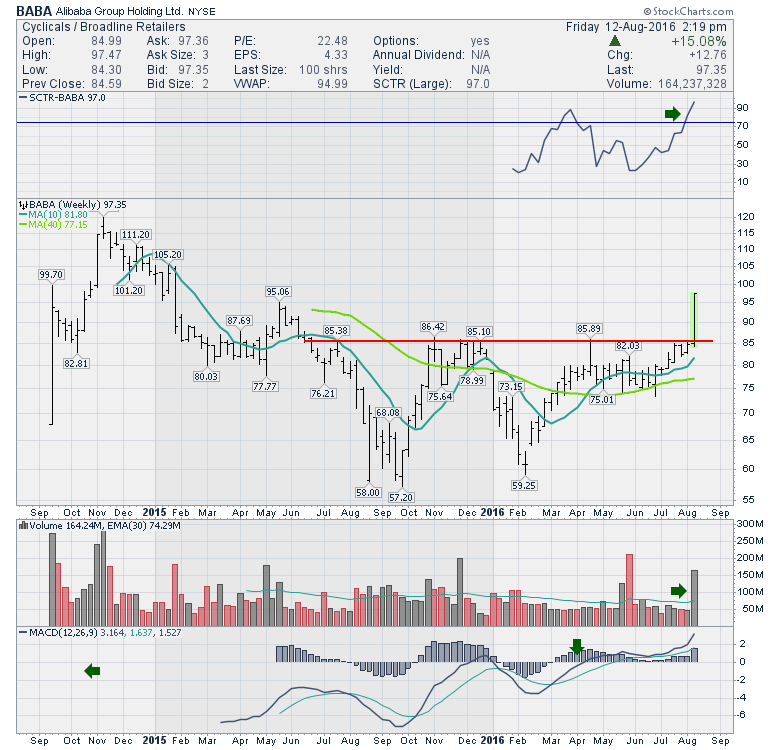
Alibaba (BABA) finally gave investors the move they have been waiting for since the IPO. A surge into the price action that represents a top performing stock. Notice the improvement this week taking the SCTR to 97... Read More
Don't Ignore This Chart! August 11, 2016 at 10:23 AM
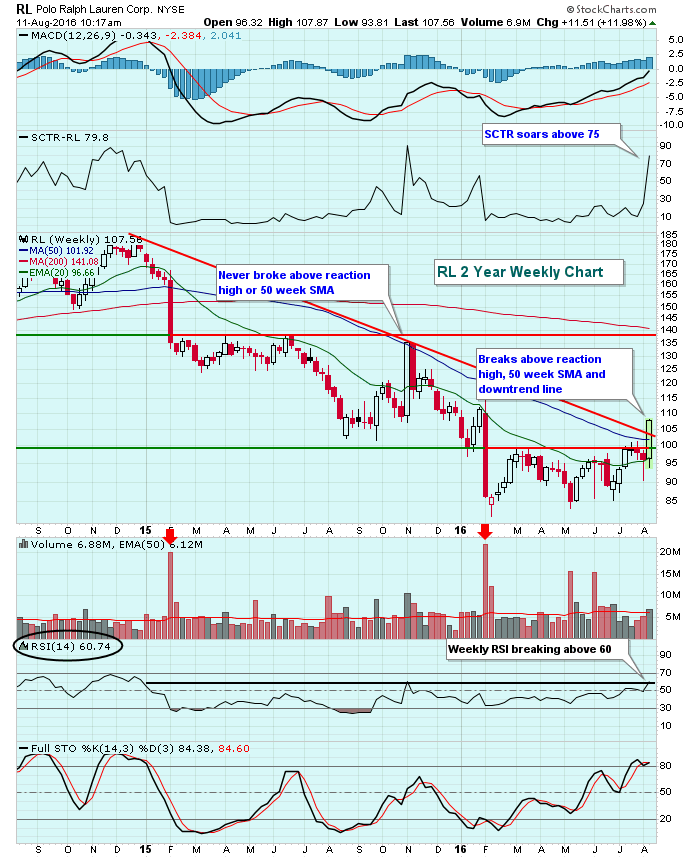
The Dow Jones U.S. Clothing Accessories Index ($DJUSCF) has been challenged technically with a long-term downtrend and a short-term uptrend currently in play... Read More
Don't Ignore This Chart! August 10, 2016 at 03:07 PM
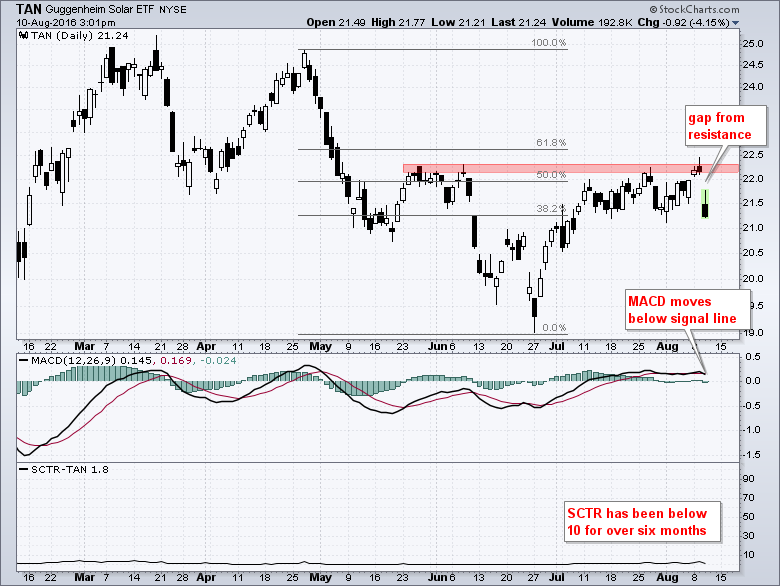
The Solar Energy ETF (TAN) got a nice bounce along with the stock market from late June to early August, but this bounce has now reversed and it looks like the bigger downtrend is resuming. The chart shows the highs from late May and early June marking resistance in the 22... Read More
Don't Ignore This Chart! August 09, 2016 at 03:19 PM
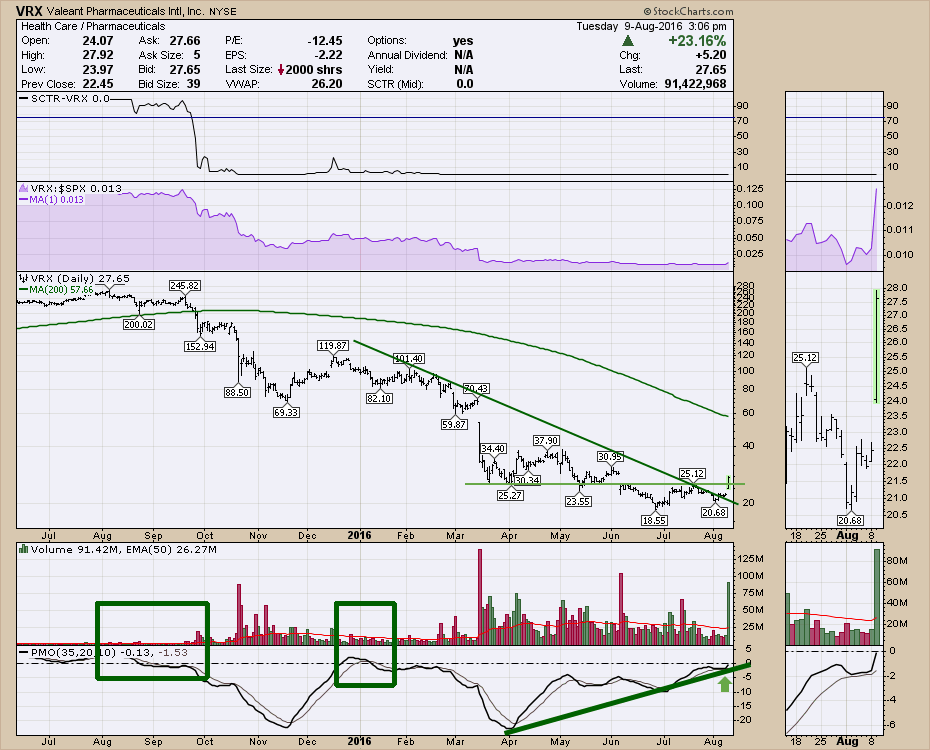
Valeant Pharma (VRX, VRX.TO) has been the world's best whipping post for buy and hold investors. High-profile investors like Pershing Square have had this millstone stock dropping 90% from the highs. But every now and then, even a "sleeping dog" stock starts to improve... Read More
Don't Ignore This Chart! August 08, 2016 at 03:23 PM
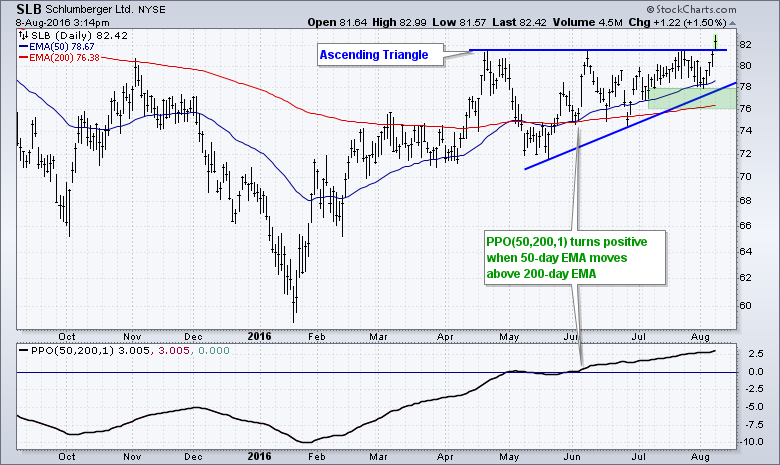
Schlumberger (SLB) broke above resistance today and this breakout confirms a bullish ascending triangle. First, note that the bigger trend is up because the 50-day EMA is above the 200-day EMA... Read More
Don't Ignore This Chart! August 05, 2016 at 12:37 PM
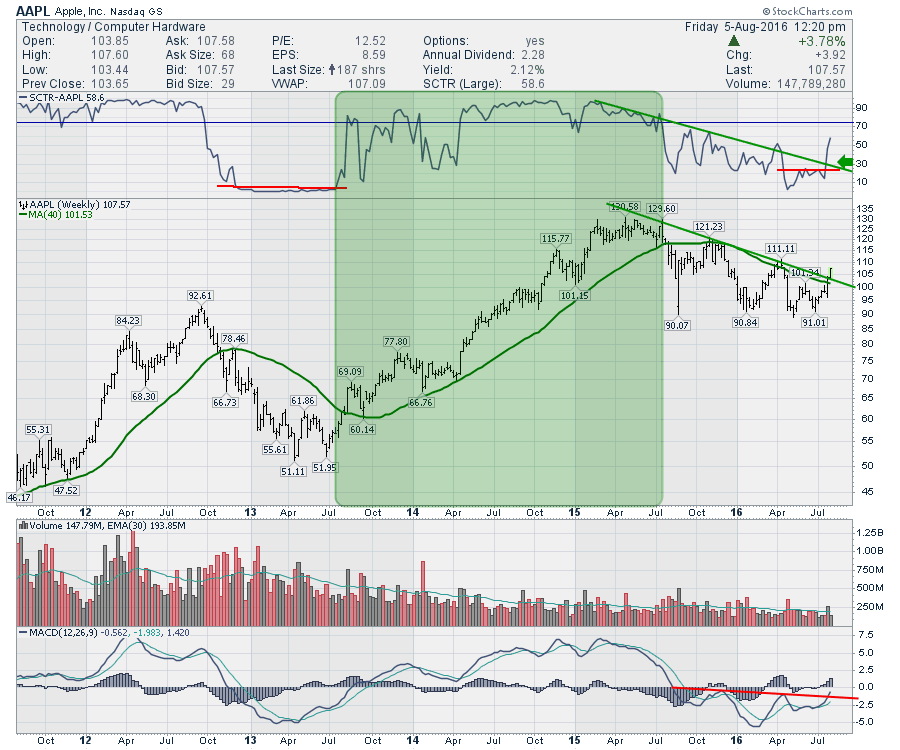
Apple (AAPL) has a couple of great things going for it. Earnings were just announced and it has a few months to run before the next earnings. It also is running up into the release of the iPhone 7. The second iteration of the watch might be released as well... Read More
Don't Ignore This Chart! August 04, 2016 at 02:29 PM
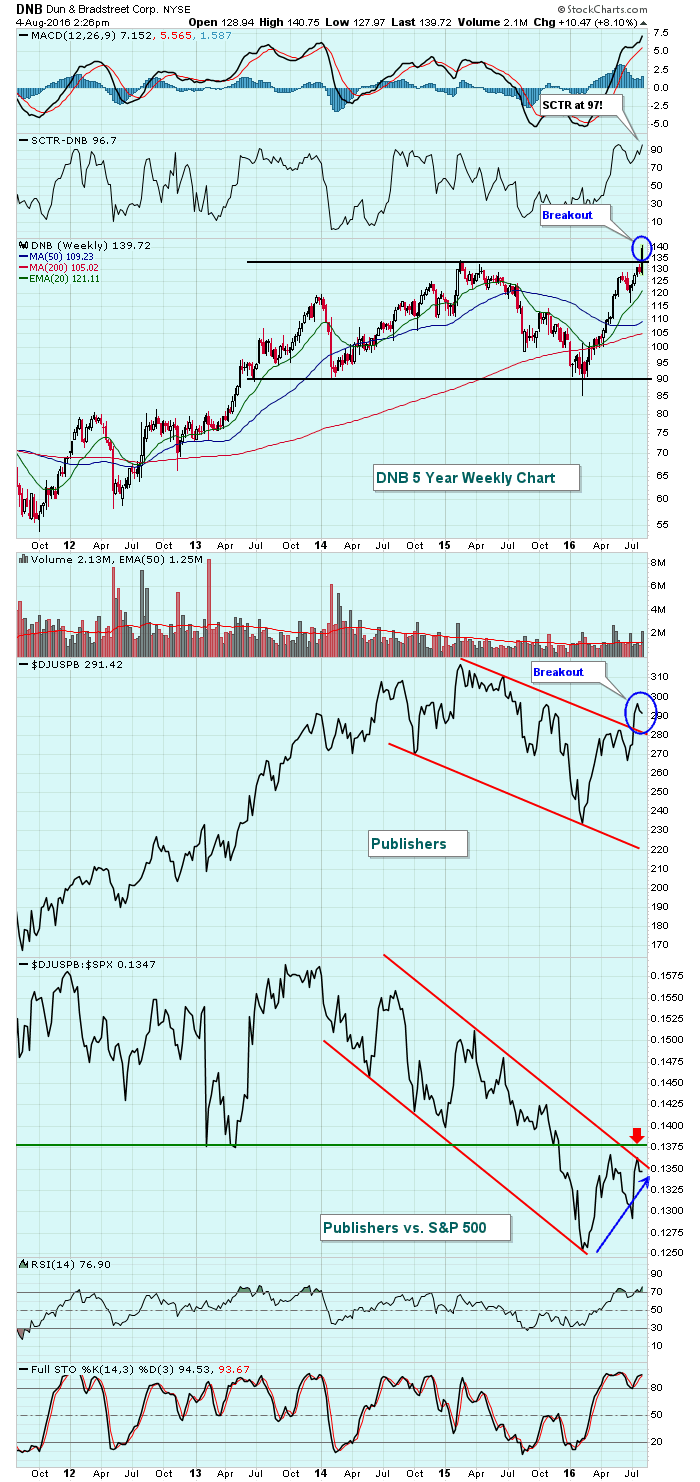
The Dow Jones U.S. Publishers Index ($DJUSPB) has broken a downtrend on its weekly chart and Dun & Bradstreet (DNB) is one of the best looking companies within this index... Read More
Don't Ignore This Chart! August 03, 2016 at 01:21 PM
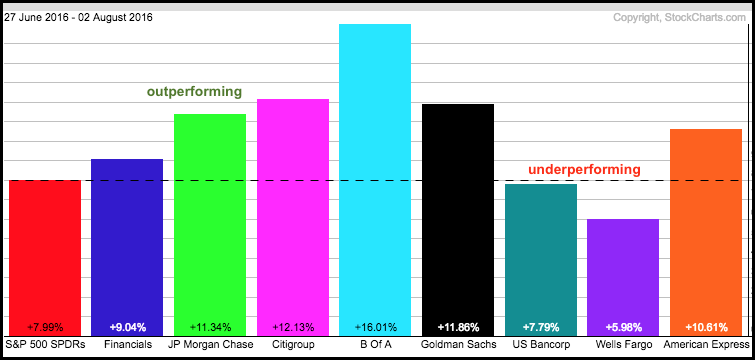
One would not think it from the price charts, but the Finance SPDR (XLF) and several banking stocks are outperforming the S&P 500 SPDR (SPY) since late June. XLF, KRE and many banking stocks are trading below their spring highs and SPY is trading near a 52-week high... Read More
Don't Ignore This Chart! August 02, 2016 at 05:18 PM
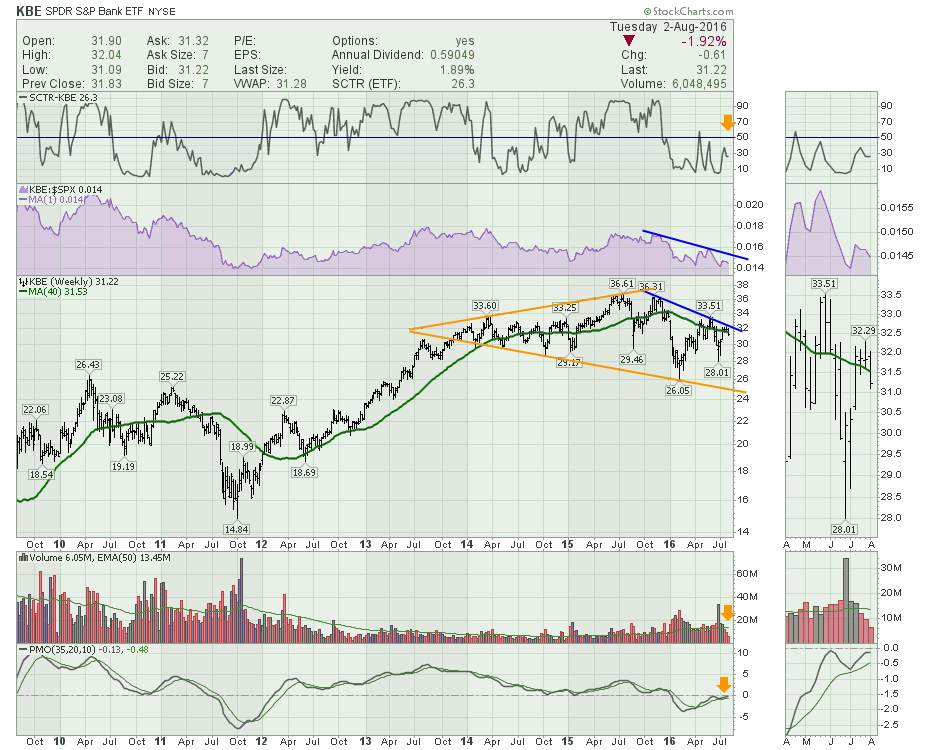
One of the difficult parts of the current market is the dichotomy between the rally to new highs in the indexes and the continued struggles of the banking group with its third lower high in the past year. KBE is the SPDR ETF for the big banks... Read More
Don't Ignore This Chart! August 01, 2016 at 12:29 PM
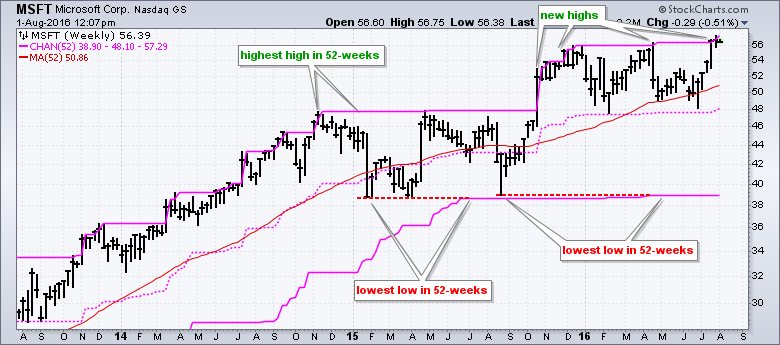
Chartists can plot 52-week highs right on the price chart by using the Price Channels overlay. The upper line of a 52-week Price Channel marks the high of the last 52-weeks, the lower line marks the low and the middle line is the average of the two... Read More