MailBag April 30, 2010 at 08:02 AM
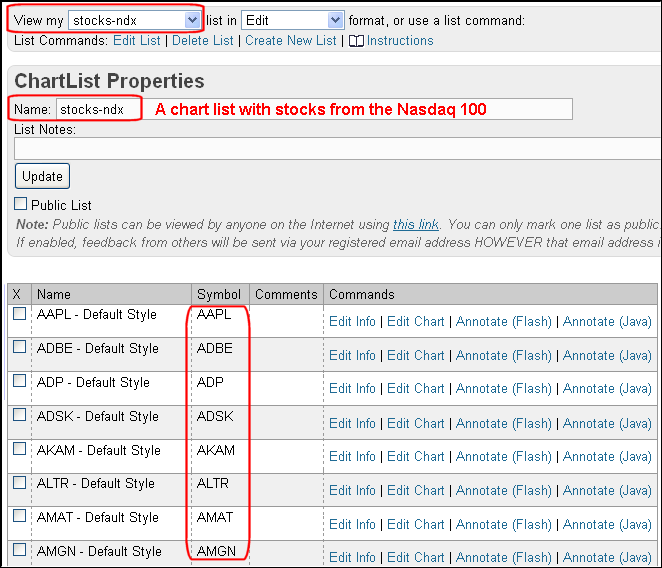
Subscribers to the Extra! Charting Service at stockcharts.com can save annotated charts to their favorites list. The Free Charting Service and Basic Charting Service allow users to annotate charts, but not to save or upload the charts. Extra! members can save up to 500 annotated charts to a favorites list and have up to 100 favorites lists. This means separate lists for your portfolio, various indices, ETFs, Nasdaq 100 stocks, breadth indicators, foreign indices, currencies, gold-related issues and much more. In addition to saving these Read More
MailBag April 23, 2010 at 08:31 AM
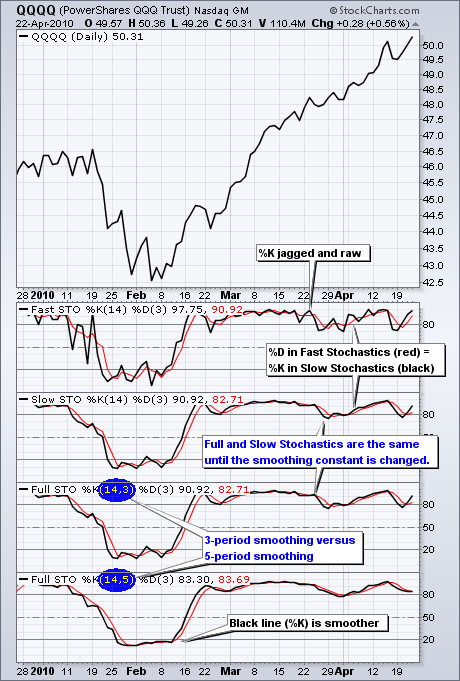
Developed by George C. Lane in the late 1950s, the Stochastic Oscillator is a momentum indicator that reflects the location of the close relative to the high/low range over a set number of periods. The location of the close is found by subtracting it from the low for that period. Here is a calculation example. 10-period high = 50 10-period low = 40 Last Price = 48 Close location = 48 - 40 = 8 High-Low range - 50 - 40 = 10 Stochastic Oscillator = 8/10 = .80 This is the calculation for the %K component of the Stochastic Oscillator (black line). Lane multiplied this Read More
MailBag April 16, 2010 at 02:01 PM
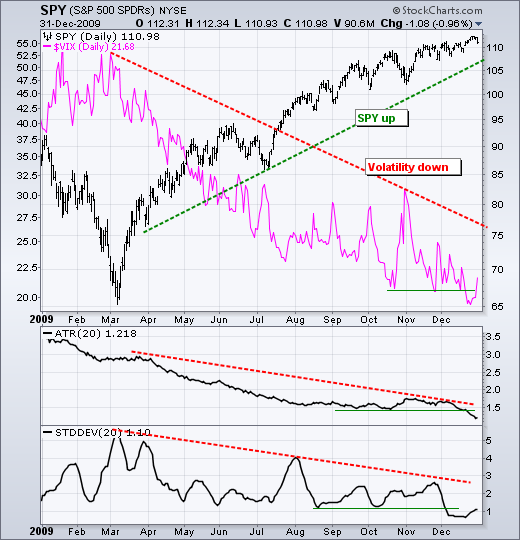
Sharpcharts offers two indicators to measure volatility: Standard Deviation and Average True Range (ATR). Standard Deviation is the classic quantitative measure of volatility that measures variation from average price. ATR uses the high-low range for the current day and the close of the prior day to calculate a range. You can read more formula details in our ChartSchool. The chart below shows SPY with the 20-day Standard Deviation and 20-day Average True Range. 20 days is about one month. Both indicators moved lower through 2009. The Standard Deviation experienced a few hiccups with Read More
MailBag April 09, 2010 at 02:55 PM
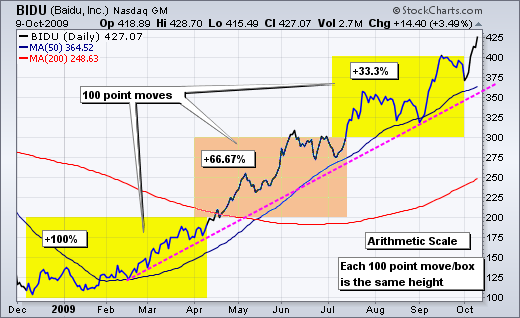
Sharpcharts users have a choice between log and arithmetic scaling. “Choice” is the key word here. There is a long running debate on the advantages and disadvantages of each scaling option. One is not any better or worse than the other. It really depends on your personal preference. A recent study by Pepko found that most Pepsi drinkers preferred log charts and most Coke drinkers preferred arithmetic charts. All kidding aside, chart scaling will not affect relatively short timeframes (a few days to a few months). There is, however, a noticeable difference with long-term charts and big Read More