MailBag May 28, 2010 at 09:15 AM
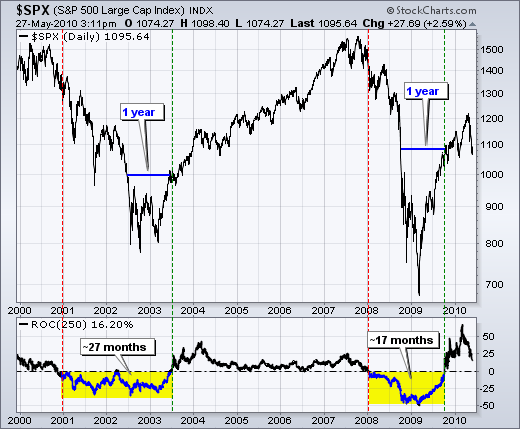
The default parameter for the Rate-of-Change oscillator is 12-periods, but this can be changed to view rolling performance over a given timeframe. Rate-of-Change measures the percentage change in price over a specified period. A 12-day Rate-of-Change covers about half a month, which is good for short-term traders. 25-day ROC covers just over a month and this is good for swing traders. A 250-day Rate-of-Change covers a year to measure annual changes. This is best suited for long-term investors. There are approximately 250 trading days in a year. Click this image for Read More
MailBag May 21, 2010 at 08:53 AM
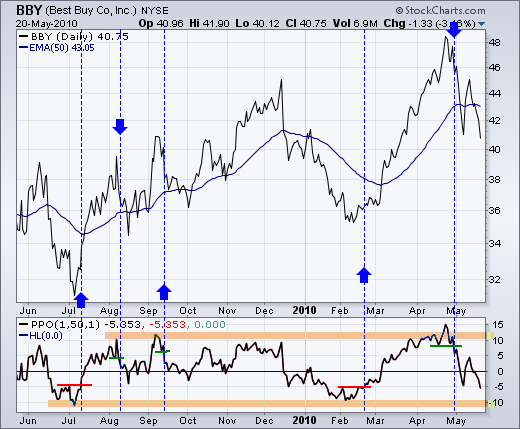
The level of MACD varies according the price of the underlying so it is better to use the Percentage Price Oscillator (PPO) for overbought and oversold readings. PPO is an oscillator similar to MACD. Both measure the distance between two moving averages. MACD shows the absolute difference, which means high priced securities have larger MACD readings than low priced securities. As its name suggests, the Percentage Price Oscillator takes this difference one step further by showing it as a percentage of the longer moving average. This makes it better suited for identifying overbought and Read More
MailBag May 14, 2010 at 01:28 PM

Bearish engulfing and dark cloud cover patterns are both bearish candlestick reversal patterns. They form after an advance and require confirmation with further downside. The “real” body of a candlestick is key to understanding these patterns. Real bodies represent the open and the close. A candlestick has a hollow body when the close is above the open. This means prices moved higher after the open. A candlestick has a filled body when the close is below the open, which means prices moved lower after the open. A bearish engulfing pattern consists of two candlesticks. The first Read More
MailBag May 07, 2010 at 07:26 AM
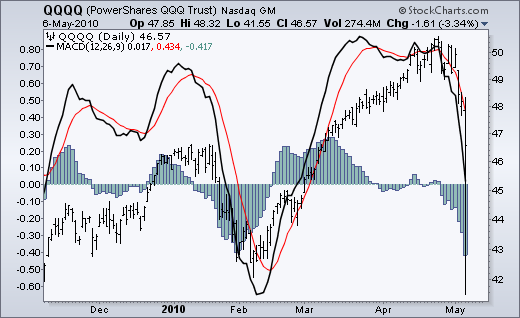
Indicators can be shown as price overlays by positioning them behind the price. After selecting the indicator in SharpCharts, simply choose “behind price” for the position. Positioning the indicator behind the price makes it easy to see the relation between the indicator and the underlying price. MACD can be positioned behind the price, but the MACD-Histogram can sometimes make the chart look cluttered. Here are the steps to remove the MACD-Histogram and view only MACD with its signal line. First: choose MACD has an indicator. Second: change the number of periods Read More