MailBag June 25, 2010 at 09:14 AM
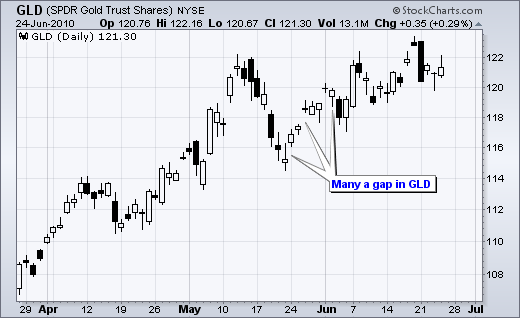
In many instances, gaps in the Gold ETF (GLD) and 20+ Year T-Bond ETF (TLT) are reactions to trading on other exchanges. These ETFs based on instruments that start trading well before US stock exchanges open. GLD is based on gold and TLT is based on bonds. Along with currencies and S&P 500 futures, these two markets are truly global. Trading starts in Asia with Japan, Australia and Singapore as dominant players. While Americans are enjoying evening activities, traders in Asia are getting ready for the markets to open. Trading then works its way west with Europe providing the next big Read More
MailBag June 18, 2010 at 10:03 AM
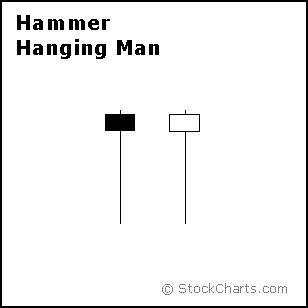
Individually, the hanging man and the hammer look exactly the same. These two candlesticks are differentiated by the prior move or short-term trend. Both candlesticks have long lower shadows and small bodies. On a daily chart, the long lower shadow reflects the intraday low. The bodies reflect the change from open to close. A small body indicates little change from open to close. Hammer and hanging man candlestick indicate that prices declined intraday, but recovered and closed near the opening level. A hammer forms within a short-term downtrend. It is, after all Read More
MailBag June 11, 2010 at 07:21 AM
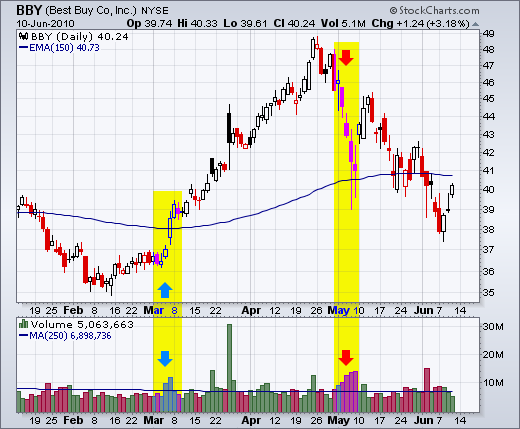
Volume is an important indicator that can be used to confirm or refute certain price movements. In particular, we may want to know if a stock is advancing on expanding volume or contracting volume. An advance on expanding volume is deemed more robust than an advance on contracting volume. The most straight forward way is to show volume with a moving average. Volume is above average when above the moving average and below average when below the moving average. There are around 250 trading days in a year. As such, a 250-day moving average of volume would provide a good measure of average Read More
MailBag June 04, 2010 at 08:24 AM
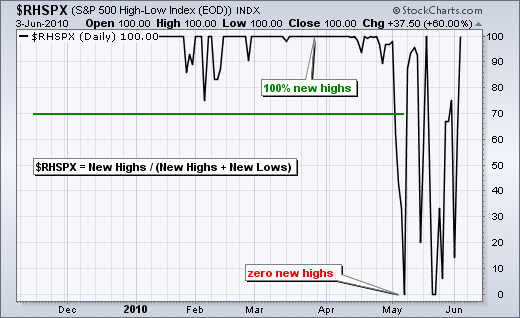
The S&P 500 High-Low Index ($RHSPX) is a breadth indicator found by dividing the number of new highs by the number of new highs plus new lows. If there are 70 52-week highs and 30 52-week lows, the indicator would be 70% (70/(70+30)). This indicator fluctuates between zero and one hundred. The chart below shows the indicator over the last seven months. It held above 70% from November to April. New highs plummeted with the stock market decline in May and this indicator hit zero in early May. This means there were zero new highs. Over the last 4-5 weeks, the indicator has been bouncing Read More