MailBag July 23, 2010 at 12:57 PM
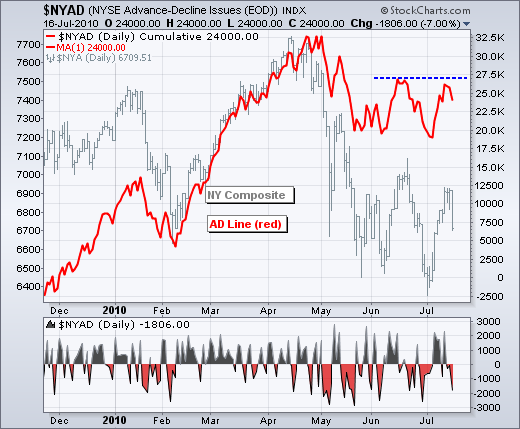
The AD Line and AD Volume Line are both breadth indicators, but the AD Line favors small-mid caps and the AD Volume Line favors large-caps. Every day there are some 3000 stocks traded on the NYSE and 2700 stocks traded on the Nasdaq. The vast majority of these are small and mid-cap issues. Large-caps are the minority. The AD Line is based on Net Advances, which is the number of advancing stocks less the number of declining stocks. An advance counts as +1 and a decline counts as -1, regardless of a stock’s market capitalization or trading volume. This means an advance or decline in Read More
MailBag July 16, 2010 at 11:25 AM
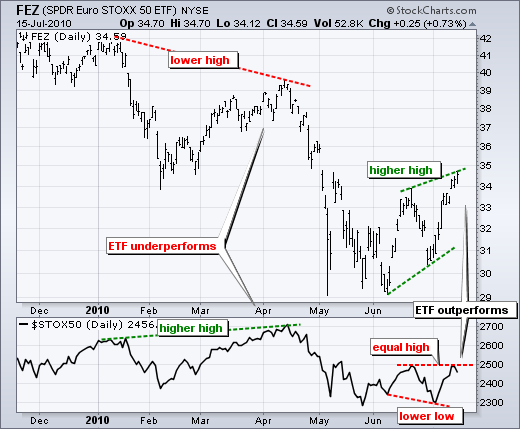
Currency movements can enhance or detract from the performance of ETFs based on foreign indices. In general, the ETFs outperform the underlying index when their currency is strong and underperform when their currency is weak. Let’s compare the Euro Stoxx 50 SPDR (FEZ) with the Euro Stoxx 50 Index ($STOX50), which are shown on the chart below. The Euro Stoxx 50 SPDR underperformed from January to April. Notice how the ETF (FEZ) formed a lower high in April as the Euro Stoxx 50 Index formed a higher high. After underperforming, the ETF (FEZ) started outperforming in June-July. Notice how Read More
MailBag July 09, 2010 at 08:51 AM
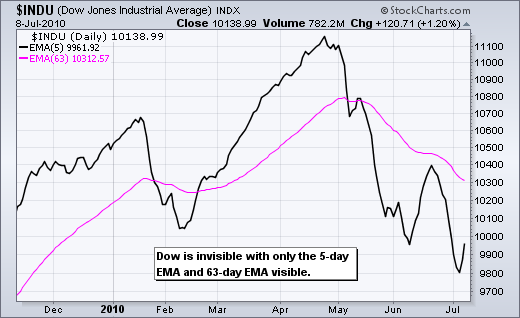
Believe it or not, there are times when an invisible indicator or price plot can help visibility. First, let’s look at the Dow Industrials in invisible mode with a 5-day EMA in visible mode. With a lot of volatility lately, showing the Dow Industrials as invisible allows chartists to focus on the overall trend - without the noise. Click this image for details Users can click on the chart above to see the settings or follow these steps. First, start with a basic bar chart. Second, select “invisible” for type. Third, go to “overlays” and add a 5-day EMA. I Read More
MailBag July 02, 2010 at 08:27 AM
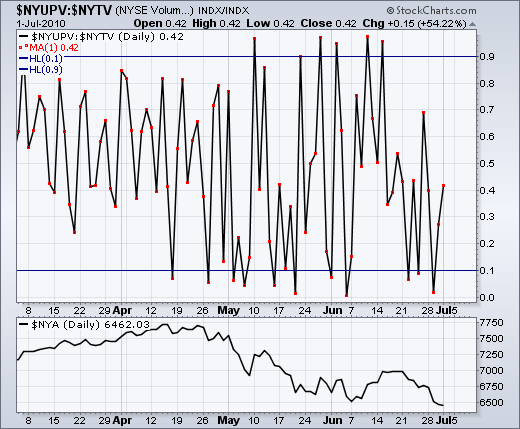
Many chartists are familiar with the term 90% up day or 90% down day. This indicator was popularized by Lowry’s research. While we cannot duplicate the exact formula used by Lowry’s, Sharpcharts users can use ratio charts to identify days when advances are 90% of the total issues traded or advancing volume is 90% of total volume. This can also be done with declines and declining volume. These indicators can be created from breadth statistics for the Amex, CNDX, Nasdaq, NYSE, and TSE - all of which are available at Stockcharts.com. In short, Sharpcharts users simply need to create a ratio Read More