MailBag March 28, 2014 at 09:01 AM
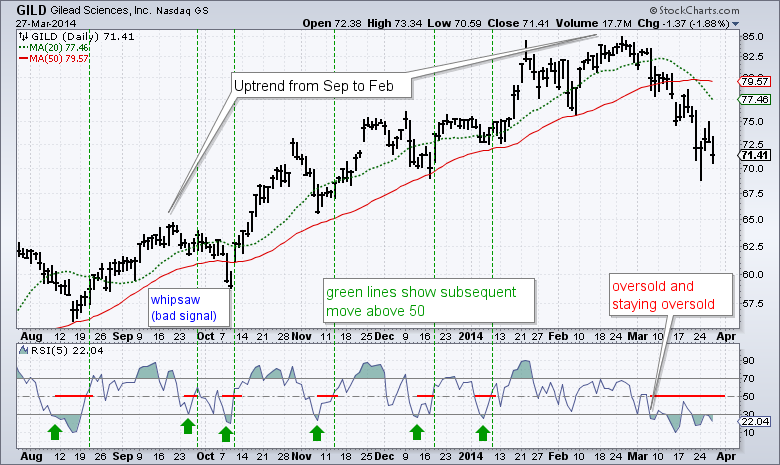
Bound momentum indicators are best suited for overbought/oversold analysis. Basically, there are two types of momentum oscillators: bound and unbound. Bound oscillators, such as RSI and the Stochastic Oscillator, fluctuate within a specific range, zero to one hundred in this case. Unbound oscillators, such as MACD and Rate-of-Change, do not have upper and lower limits. This makes them relatively difficult to use for overbought/oversold analysis. he example above shows Gilead (GILD) with 5-period RSI in the first indicator window. I am using 5-period RSI instead of 14-period RSI Read More
MailBag March 24, 2014 at 08:04 PM

The powerful SCTR value now shows in the scan results page. This is one of the strongest values to be presented among the scan results data. With a quick glance viewers can see sector, industry,price,volume, and the SCTR value. This works on all the SCTR types. It will generate a results page like this. This is very, very powerful. If you are new to scanning, check out the scanning blog that runs with Gord Greer. Scanning! You can also read the Read More
MailBag March 21, 2014 at 08:04 AM
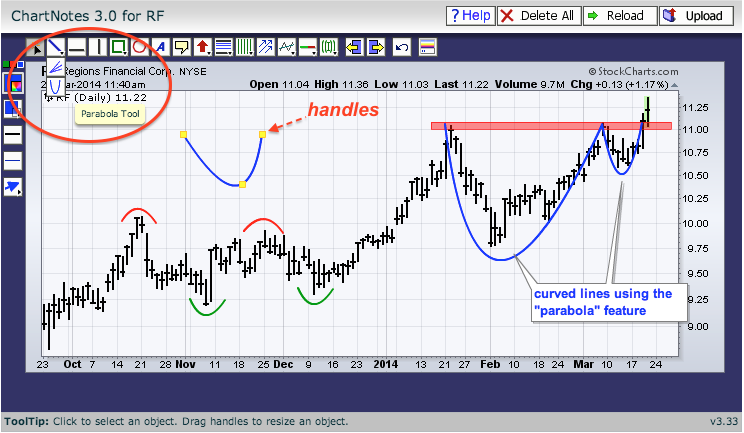
Chartists can draw curved lines by selecting the "parabola" feature in the ChartNotes workbench, which is used to annotate a SharpChart. A parabola is a symmetrical curve that forms two uniform halves when bisected. Curved lines are helpful for annotating double tops and bottoms, head-and-shoulder patterns, peaks, troughs and cup-with-handle patterns. Chartists can access the "parabola tool" in the upper left corner of ChartNotes. First, click the annotation link on a SharpChart to open ChartNotes. Second, click the tiny triangle in the trend line icon to see the other icons (option) Read More
MailBag March 14, 2014 at 09:04 AM
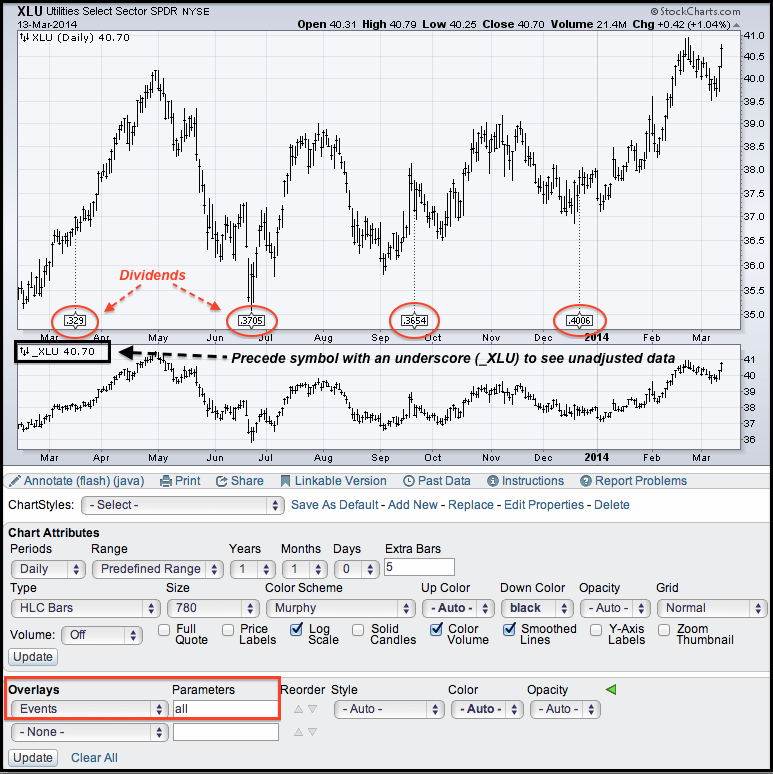
Chartists can view dividends and price adjustments by adding "events" as an indicator overlay. Enter "all" as a parameter and click update. The refreshed chart will show the dividend amounts with dotted lines marking the date. The chart for the Utilities SPDR (XLU) shows four dividends over the past year. The first dividend was in mid March 2013 so it looks like we will see another dividend soon. The lower window shows a chart for XLU with unadjusted data. Simply precede any symbol with an underscore (_XLU) to plot data that has not been adjusted for dividends. Unadjusted means the Read More
MailBag March 10, 2014 at 04:47 PM
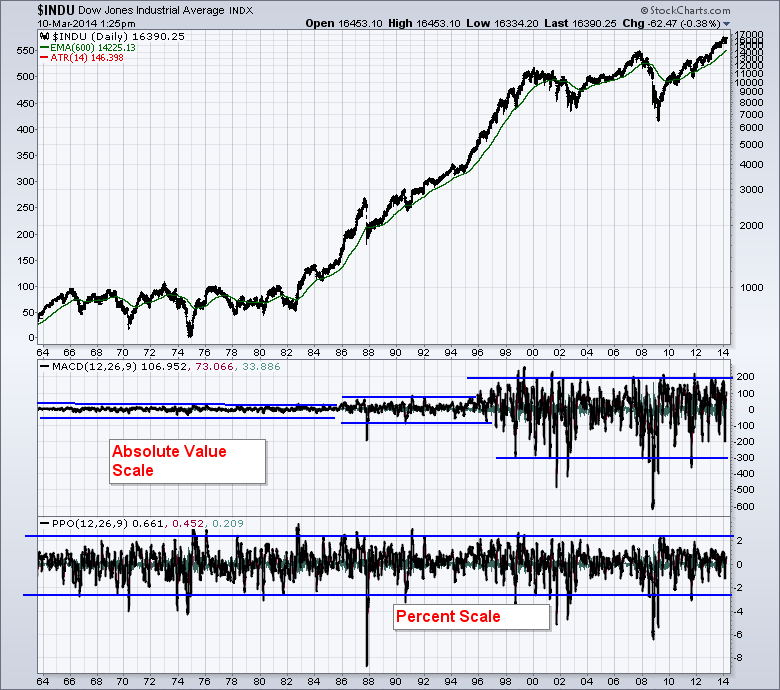
In publishing an article last week with PPO, we received an email back asking why we started using PPO and what is it? Here is a chart of both the PPO and the MACD applied to the $INDU chart. First of all, let's work through what the PPO is and why it is has benefits. PPO - stands for Percentage Price Oscillator. So rather than measuring the absolute price difference, it measures the percentage price difference. The reason this is important is for stocks or indexes with big differences in Read More
MailBag March 07, 2014 at 07:59 AM
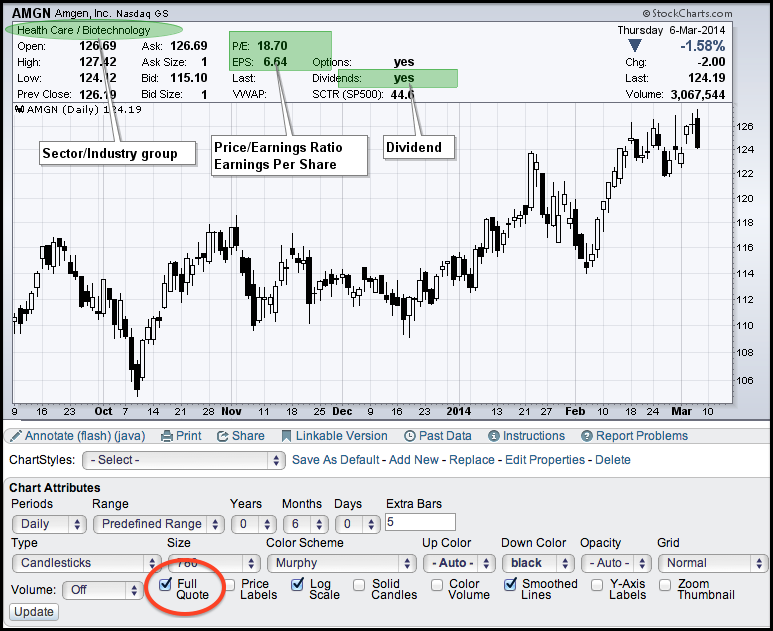
Chartists can access some basic fundamental information by selecting the full quote option, which is a check box under Chart Attributes. Checking this box will show chartists the sector/industry group, the P/E ratio, the Earnings Per Share (EPS) and the dividends (yes/no). Chartists can also view recent trading activity, such as the bid, bid size, ask, ask size and last trade size. There is also the Volume Weighted Average Price (VWAP) and the StockCharts Technical Rank (SCTR), which is available for stocks for the S&P 500, S&P MidCap 400, S&P SmallCap 600 and Toronto Stocks Read More