|
|
Over the past year, more and more stock sites are offering "Free real-time" data and charts. Here at StockCharts, we too have been working hard to provide our users with more options when it comes to up-to-date data. The really exciting news is that we are now really close to being able to provide a "Free real-time" option also.
Before I talk about that however, I wanted to talk a little bit about what "Free real-time" actually is and how it differs from the "Real real-time" that we currently offer. It is important to understand that there are several significant limitations that most of those other sites don't tell you about when it comes to "Free real-time."
First off, where does "Free real-time" data come from? It's important to understand that it does NOT come from the major stock exchanges. Those exchanges only provide trading data to companies (like StockCharts) that pay licensing fees and follow their strict rules for distributing exchange data. For the sake of this discussion, I'm going to call non-delayed price and volume information that comes from the major stock exchanges "Real real-time" data. "Real real-time" data is what we've been offering on StockCharts for years and we will continue to offer it into the foreseeable future.
"Real real-time" data is a very accurate reflection of the price and volume for a particular stock. Because the vast majority of investors buy and sell stocks via the major exchanges "Real real-time" data from those exchanges most closely reflects the actual value and demand for those stocks. If you trade a stock via a normal stock brokerage without any special instructions, they will execute the trade on one of the major exchanges using the "Real real-time" pricing.
"Free real-time" data comes from one of the minor exchanges. There are lots of smaller exchanges around which trade stocks but historically the volume of these exchanges is very, very low. Historically, the smaller exchanges also had the same legal restrictions about distributing data as the major exchanges did. Given those limitations / restrictions (and the fact that we already had data from the major exchanges), we chose not to provide data from the smaller exchanges on our site.
But then something changed...
In June of 2005 a new player appeared on the scene, the BATS Exchange, and it decided to use different rules. Specifically, it didn't implement all of the heavy restrictions on trading data that all other exchanges had. BATS data is free to redistribute(!).
When BATS first came out, it was an interesting idea but it still needed to prove itself - it needed to become popular enough that its data would closely match the data coming from the major exchanges. If very few people traded on the BATS Exchange, its prices would be very different. In 2009, BATS eclipsed the other minor exchanges to become the third largest exchange in the US, a good indication that BATS price data is very close to the prices on the major exchanges.
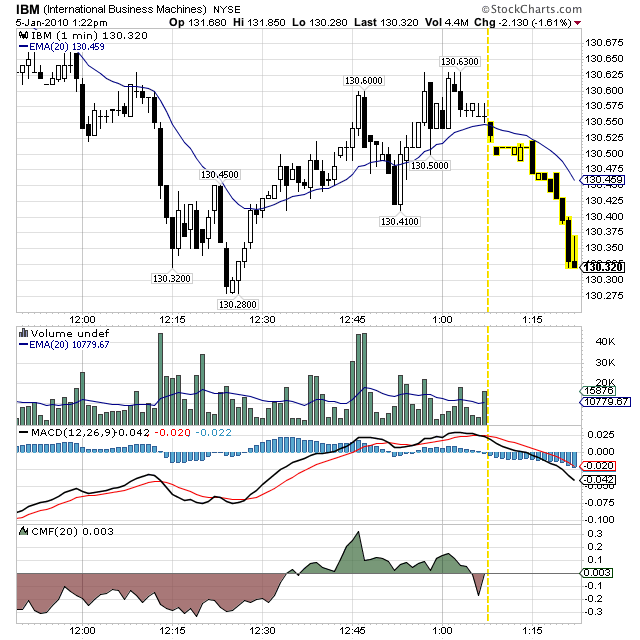
Given that accomplishment, we felt it was time to start adding BATS data to our website. That project is just about complete. When finished, it means that all of our charts that currently display delayed data (with the yellow highlight) will display "Free real-time" data from the BATS exchange instead. Here's an example of what that kind of chart will look like:
The dashed yellow vertical line shows the dividing point between the delayed data from the NYSE and the non-delayed data from BATS. All of the yellow highlighted bars are from the BATS exchange.
As time goes on, the yellow bars will get replaced with "official" data from the NYSE (on the left side of the dashed line) and new BATS bars will appear on the right edge of the chart.
Now, there is one other aspect of this chart that is very important to notice and understand. There is no volume displayed for the BATS bars. While the BATS exchange is more popular than the other small exchanges, it is still much smaller than the major exchanges. Thus, the volume data that BATS provides is much smaller. If we added BATS volume data to our charts, it would significantly distort any volume-based indicators and signals. Because of those issues, we have decided to leave BATS volume data off of our charts.
(Side Note: Some other services will multiply BATS volume values by some arbitrary factor to make its bars look similar to the "official" volume bars. The problem with that approach is that it overemphasizes small changes in BATS volume. It also doesn't help if BATS volume is zero for a given period.)
So in summary:
"Free real-time" == BATS Exchange data
Pros: Free
Cons: Price data may be slightly off, Volume data is waaaaay off. US stocks only.
"Real real-time" == Major Exchanges' data
Pros: "Official" price and volume data.
Cons: Not Free
We hope to offer "Free real-time" on our site by the end of January (although that could change - don't shoot me if it does!). When we do, you will have a choice of using either the BATS real-time data or the "Real real-time" data that we offer now. Delayed data will become a thing of the past.
And yes, if you are a "Real real-time" subscriber now and you want to downgrade to "Free real-time" when it becomes available, we will give you a way to do that. Stay tuned for all the details.


