|
|
On Balance Volume (OBV) and the Accumulation Distribution Line (ADL) sometimes diverge because their formulas are quite different. Both are cumulative volume-based indicators that measure the flow of volume. OBV is based on the change from one period to the next, but the Accumulation Distribution Line is based on the level of the close relative to the high-low range within a given period. OBV ignores price action within a given period. The Accumulation Distribution Line ignores price action outside a given period. Basically, On Balance Volume rises when the close is up and falls when the close is down. The Accumulation Distribution Line (ADL) advances when the close is in the upper half of the high-low range and declines when the close is in the lower half.


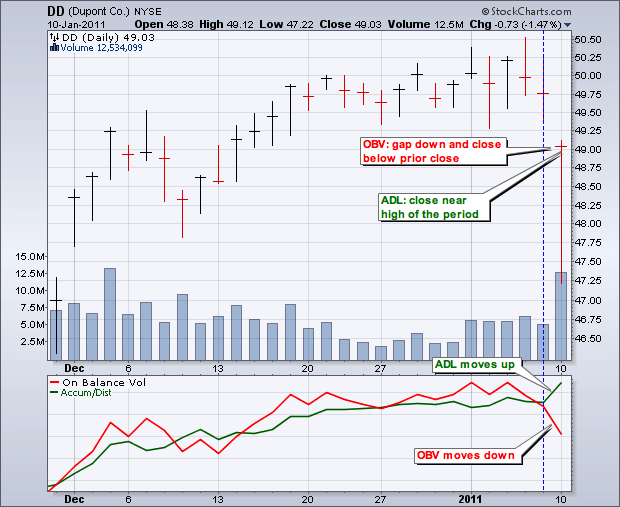
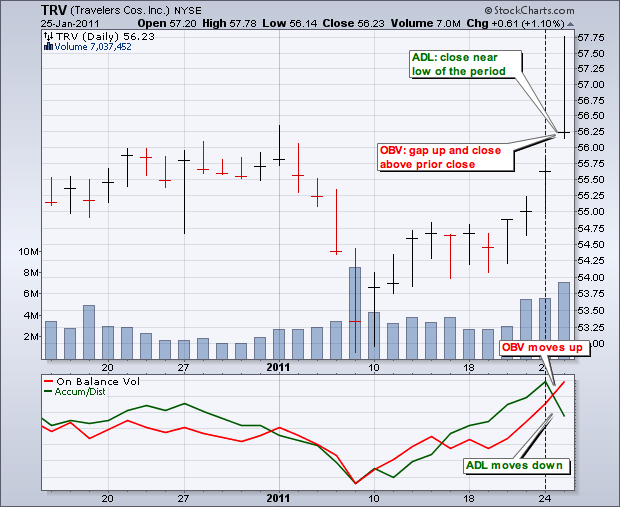
The charts above provide examples when On Balance Volume (OBV) goes one way and the Accumulation Distribution Line goes the other. Dupont (DD) gapped down on 10-Jan and closed below its prior close to push OBV lower. However, the close was near the high for the day and this pushed the Accumulation Distribution Line higher. Travellers (TRV) gapped up and closed up to move OBV higher. However, the close was near the day’s low and this moved the Accumulation Distribution Line lower. So which indicator is better? Traders that eat spaghetti and meatballs generally do better with OBV. Traders that prefer spaghetti with sausage do better with the Accumulation Distribution Line. Sorry, just a little attempt at Friday humor. Neither is better or worse. They simply measure different things. Chartists can easily plot both in the same indicator window to enhance the robustness of volume flow analysis. Also see our ChartSchool articles on On Balance Volume and the Accumulation Distribution Line.


Posted by: Jim Miller January 28, 2011 at 14:02 PM
Posted by: Mark Dobbins January 28, 2011 at 17:56 PM
Posted by: Shawn Clinton January 29, 2011 at 13:34 PM