
|
StochRSI, or Stochastic RSI, is the Fast Stochastic Oscillator applied to RSI. This makes it a momentum oscillator of a momentum oscillator. Velocity is a term that could be used to describe the momentum of momentum. The chart below shows Carmax (KMX) with RSI(14) in the first indicator window. RSI(14) and the Full Stochastic Oscillator (14,1,1) are in the middle indicator window. StochRSI(14) is in the lower indicator window. This full Stochastic Oscillator setting (14,1,1) is essentially the Fast Stochastic Oscillator.
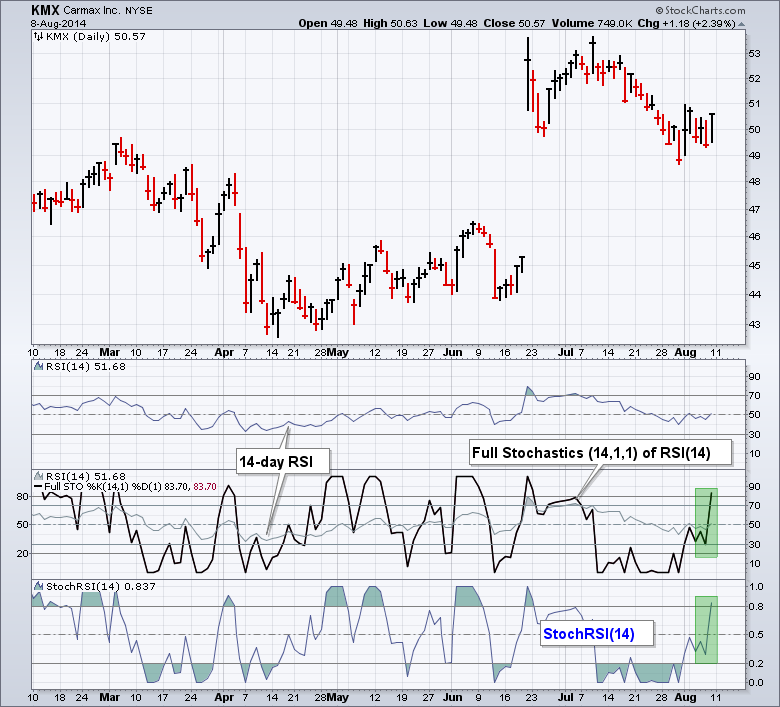
First, notice how the Stochastic Oscillator (14,1,1) matches with StochRSI(14). Second, notice that StochRSI oscillates between zero and one. So what does 14-day StochRSI actually tell us? A move to 1 signals that 14-day RSI is at a 14-day high. A move to 0 signals that 14-day RSI is at a 14-day low. Note that a surge to 1 often signals an upside breakout in RSI, while a plunge to 0 signals a downside break in RSI. These signals can be used to get the jump on a change in momentum. The green areas show StochRSI surging above .80 and the Stochastic Oscillator surging above 80. You can read more about StochRSI in our ChartSchool article.

Posted by: Tushar Chande August 10, 2014 at 07:40 AM
Posted by: Arthur Hill August 21, 2014 at 05:33 AM