
|
This is a step-by-step tutorial for creating a cumulative indicator using SharpCharts. Cumulative indiators are handy for constructing Advance Decline Lines, Advance Decline Volume Lines and a Cumuatative Net New Highs lines. This example will create the AD Line for the NYSE.
Create SharpChart for NYSE Net Advances
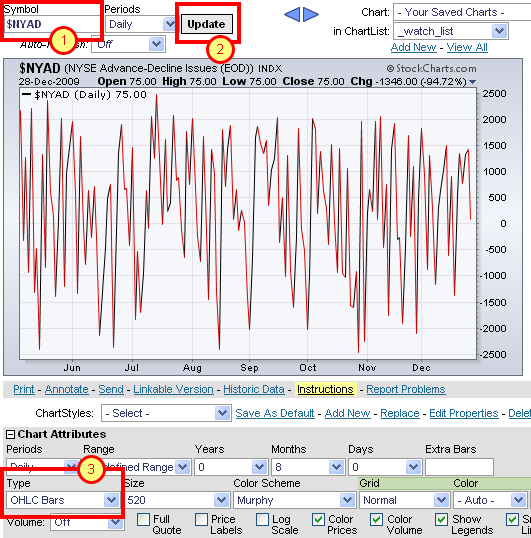
Start by creating a SharpChart for NYSE net advances ($NYAD). Enter $NYAD for symbol and click update to bring up the chart. Your chart may look different because of different settings, but the main plot ($NYAD) should oscillate above and below the zero line. Now go to "Type" in the "Chart Attributes" section below the chart.
Select Cumulative for Chart Type

Click on "type" to see all the options and select "Cumulative". Click "Update" to create the new chart.
The Finished Chart!
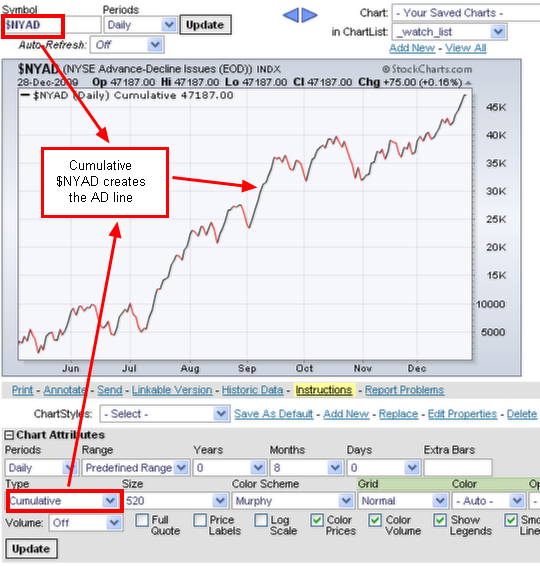
The end result is the Advance Decline Line for the NYSE. With the cumulative option, users can create the AD Lines, AD Volume Lines and Net New Highs Lines for the NYSE, Nasdaq and AMEX. You can even overlay a chart of the underlying index to compare performance. Hint: Go to "Indicators", choose "Price", enter symbol ($NYA) for "Parameters", "Position" behind price and then click "Update".
NOTE: For a complete list of all of our "Advance-Decline" indexes, simply type "Advance-Decline" in any of the "Create a Chart" boxes at the top of our web pages.