
|
The Percentage Price Oscillator (PPO) is a momentum oscillator that measures the difference between two moving averages as a percentage of the larger moving average. The PPO-Histogram can be used to anticipate signal line crossovers in the PPO. You can add a solid line at the Zero level to more easily identify crossovers. This entry shows how to add a solid line to the histogram.
Add PPO Indicator To The Chart
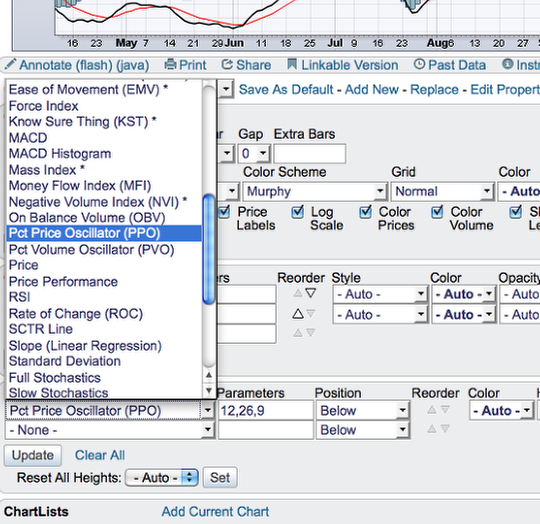
Click on the "Indicators" dropdown and select "Pct Price Oscillator (PPO)"
Add A Horizonal Line Overlay
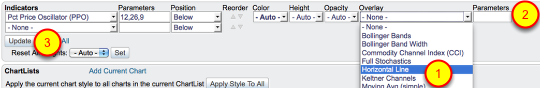
Click on the dropdown for "Overlay" in the indicator "Advanced Options" section. If the "Advanced Options" is not expanded, click on the green arrow first. Then, select the "Horizontal Line" option, enter the number "0" in the "Parameters" box and click "Update."
The Result
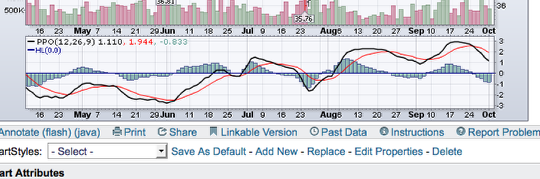
The PPO now has a solid line at the Zero. Information about the PPO indicator, calculation and interpretation is available in this article.