Art's Charts January 29, 2010 at 07:00 AM
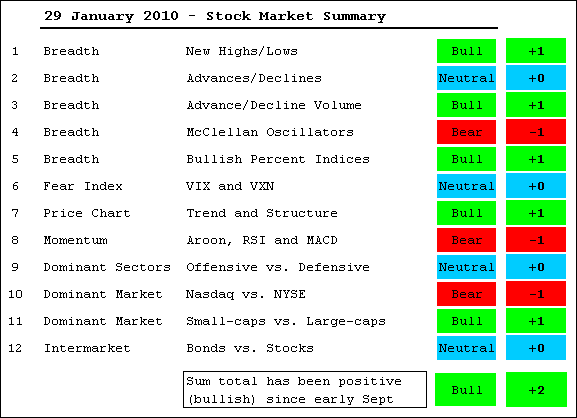
With a sharp decline over the last two weeks, it is hardly surprising that the bullish evidence weakened considerably since early January. Three indicators are considered bearish. The McClellan Oscillators both plunged below -50 to signal a sharp thrust in selling pressure... Read More
Art's Charts January 29, 2010 at 04:23 AM
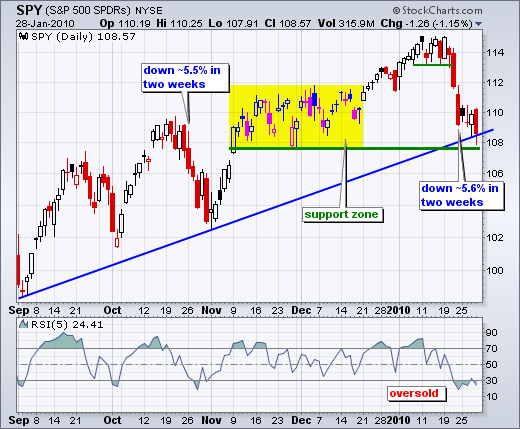
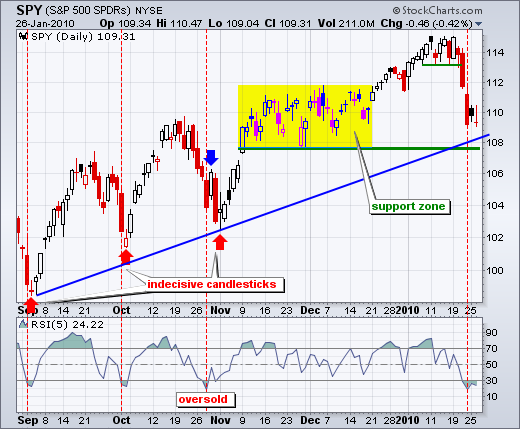
SPY opened strong and closed weak to form a long red candlestick. After three indecisive candlesticks Monday through Wednesday, Thursday's failed rally reflects the skittishness of traders/investors. Even so, SPY remains in a support zone around 109 (plus or minus 1 point)... Read More
Art's Charts January 28, 2010 at 05:17 AM
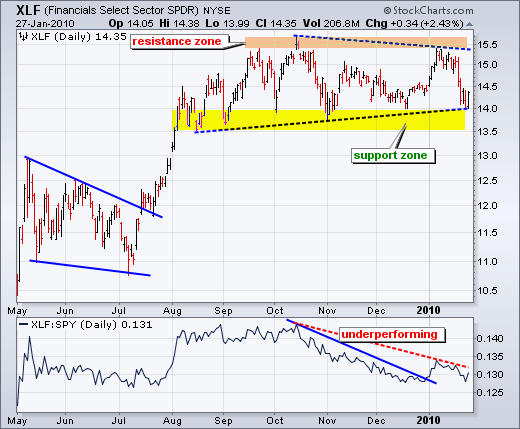
ETFs: XLF, XLY, GDX, XHB, SMH, TLT Stocks: A, DVN, ERTS, KBH, LAZ, PGN, PSA, QCOM, WF... Read More
Art's Charts January 28, 2010 at 04:06 AM
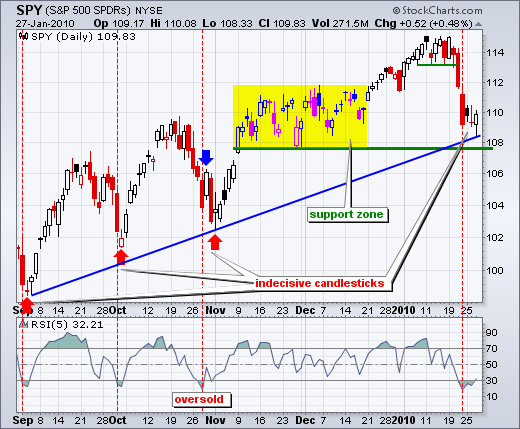
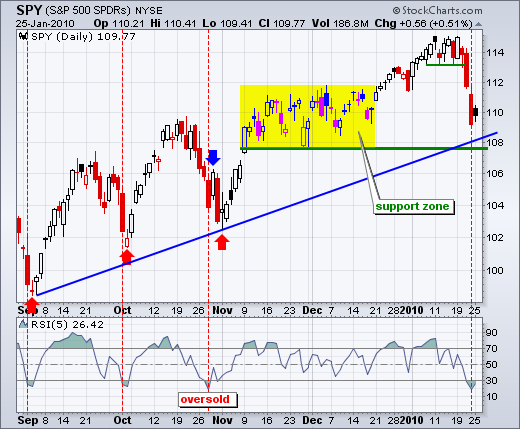
After becoming oversold with last week's decline, SPY firmed over the last three days and established some support around 109. There was an inside day on Monday, a failed rally candlestick on Tuesday and a strong close candlestick on Wednesday... Read More
Art's Charts January 27, 2010 at 05:58 AM
After two long red candlesticks and a sharp decline last week, the S&P 500 ETF (SPY) stalled the last two days. A small black candlestick formed on Monday and a failed rally candlestick formed on Tuesday. I call this a failed rally candlestick because the ETF hit 110... Read More
Art's Charts January 26, 2010 at 01:30 AM
After a long red candlestick and sharp decline on Friday, the S&P 500 ETF (SPY) stalled with an inside day on Monday. Taken together, the red candlestick and smaller black candlestick form a harami, which is a potential reversal pattern... Read More
Art's Charts January 25, 2010 at 04:25 AM
Last week's three-day decline in the S&P 500 ETF (SPY) was the steepest 3-day decline since March, Despite two long red candlesticks and this 3.9% decline, I still consider the medium-term trend up... Read More
Art's Charts January 22, 2010 at 12:30 PM
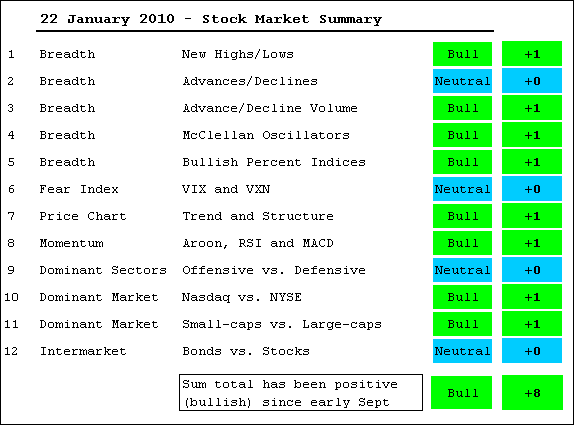
The bulk of the evidence remains bullish for stocks, but this week's sharp decline put a dent in the bullish case. Some brief comments are posted after the jump. I will also be posting a market message later this afternoon. -Net New Highs remain positive for Nasdaq and NYSE... Read More
Art's Charts January 22, 2010 at 09:55 AM
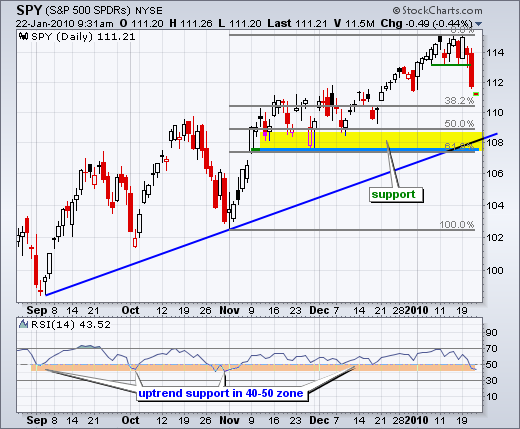
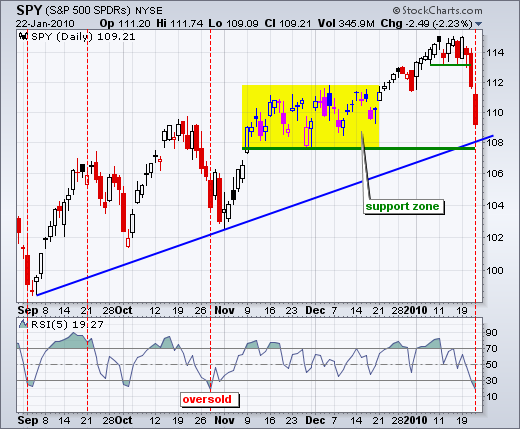
After consolidating around 114 for a couple weeks, SPY broke short-term support with a long red candlestick on Thursday. Even though this looks like a convincing support break, it is still just a short-term phenomenon because the medium-term trend remains up... Read More
Art's Charts January 21, 2010 at 11:20 AM
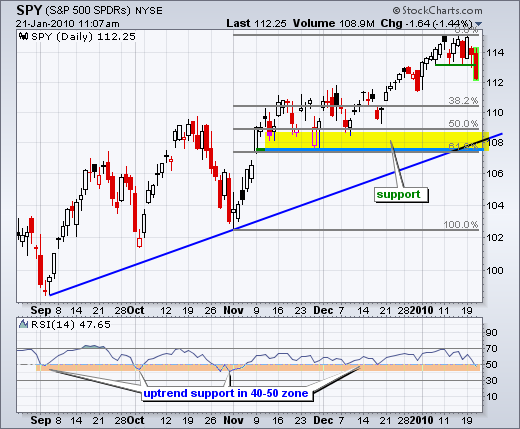
Even though the trend on the daily chart remains up, SPY broke short-term support and a correction appears to be unfolding. With the short-term support break, we can now start estimating a downside target for this correction... Read More
Art's Charts January 20, 2010 at 12:34 PM
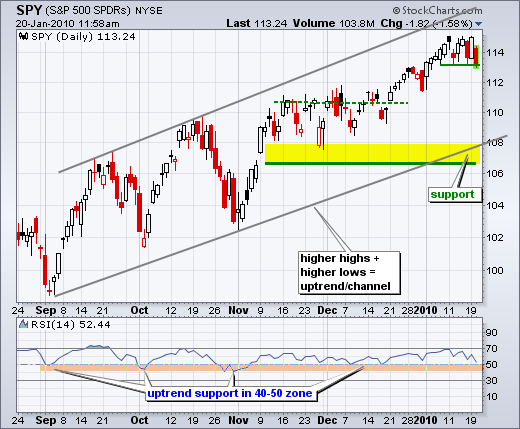
The medium-term uptrend is not in jeopardy at this point, but there is a clear battle raging around 114 as SPY crossed this level six times in the last eight days. Three of the downside crosses featured some intense selling pressure... Read More
Art's Charts January 19, 2010 at 11:20 AM
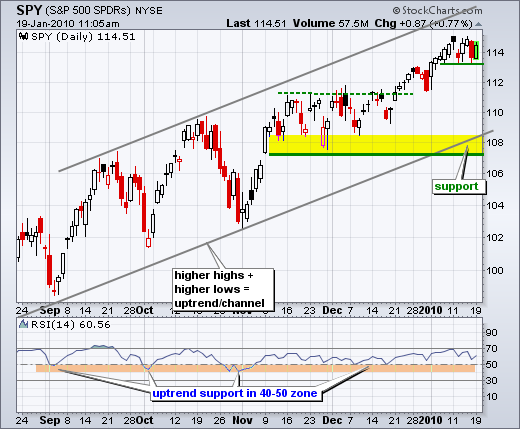
There is no change in the medium-term uptrend (daily chart). SPY is trading in the upper half of a rising price channel. Starting from around 103 in early November, the ETF broke resistance at 111 in late December and moved above 114 in early January... Read More
Art's Charts January 15, 2010 at 12:08 PM
Even though stocks seem overbought and ripe for a correction, there is still more evidence of buying pressure than selling pressure. This means that a correction would be just that - a pullback within a bigger uptrend... Read More
Art's Charts January 15, 2010 at 11:17 AM
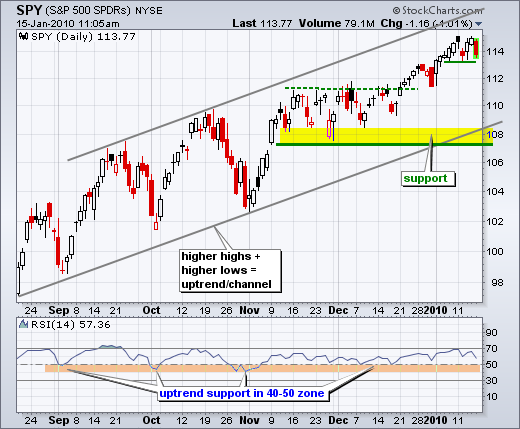
SPY is meeting resistance in the 115 area with a gap down on Monday and some weakness on Thursday. This is not enough to affect the medium-term uptrend. Short-term, the ETF is testing the lower trendline of a rising price channel. Support is marked in the 113-113.5 area... Read More
Art's Charts January 14, 2010 at 11:19 AM
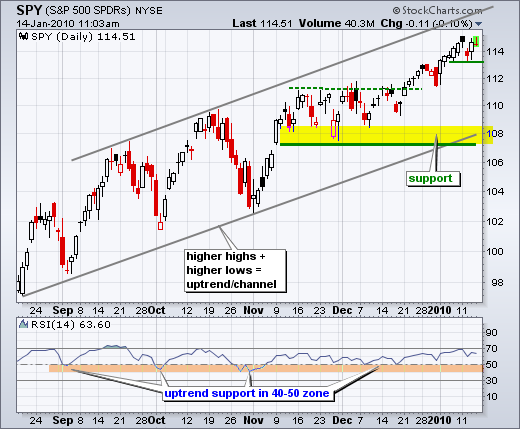
Both the daily and 60-minute charts show SPY within rising channels. The daily chart captures the bigger uptrend, while the 60-minute chart captures the short-term uptrend... Read More
Art's Charts January 10, 2010 at 09:00 AM
There is no change in SPY. Both the short-term and medium-term trends remain up, but both are getting overextended and ripe for a pullback or consolidation. Even though this is not reason enough to turn bearish, it does argue for caution on the bullish side... Read More
Art's Charts January 08, 2010 at 08:52 AM
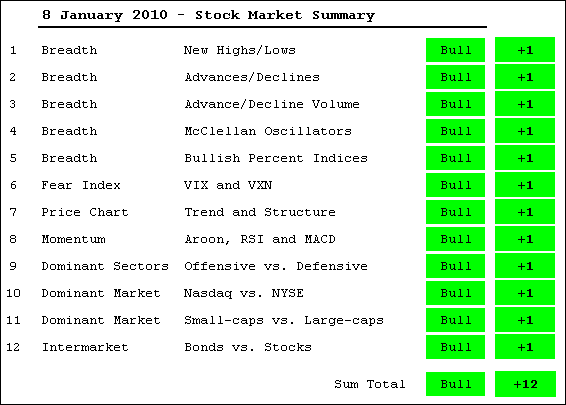
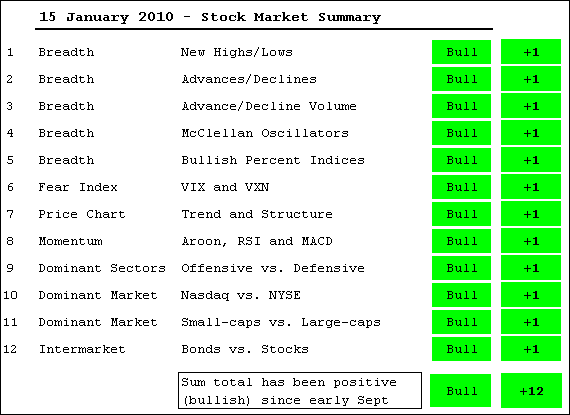
The bulk of the medium-term evidence remains bullish for stocks. Commentary featuring some of these indicators can be found in the Market Message later today. There is a brief run down of the 12 indicator groups after the jump... Read More
Art's Charts January 08, 2010 at 04:58 AM
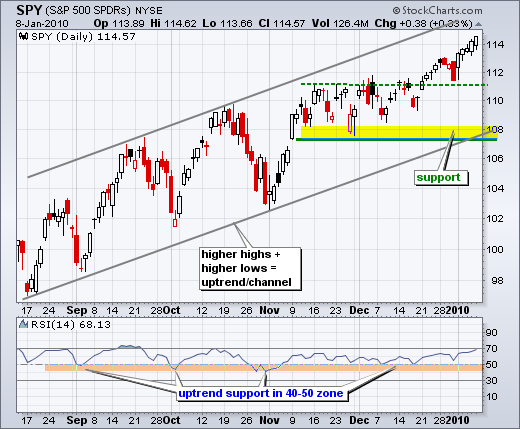
As one may have guessed, there is no change in SPY. I am, however, providing updated daily and 60-minute charts. On the daily chart, SPY continued its January run with a close above 114 for the first time since September 2008... Read More
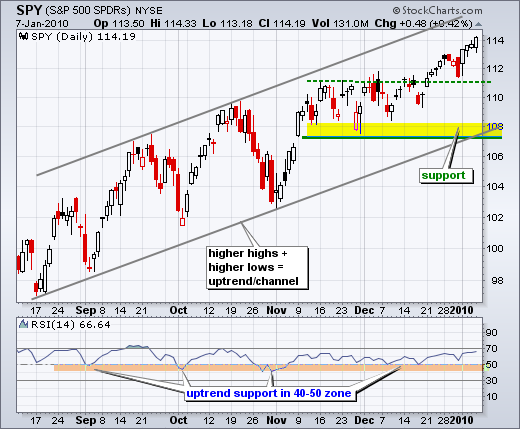
Art's Charts January 07, 2010 at 05:16 AM
There is no change on the daily or 60-minute charts, both of which are currently bullish. SPY has been up 14 of the last 19 trading days with the ETF moving from ~109 to ~114 over this four week period (up ~4.5% since December 9th)... Read More
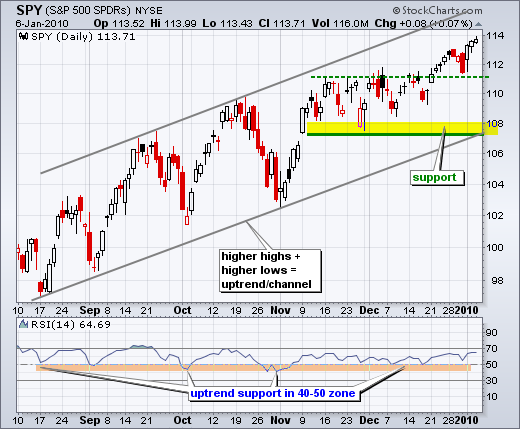
Art's Charts January 06, 2010 at 07:57 AM
There is no change in my SPY analysis, but I will post updated daily and 60-minute charts for your viewing pleasure... Read More
Art's Charts January 05, 2010 at 06:30 AM
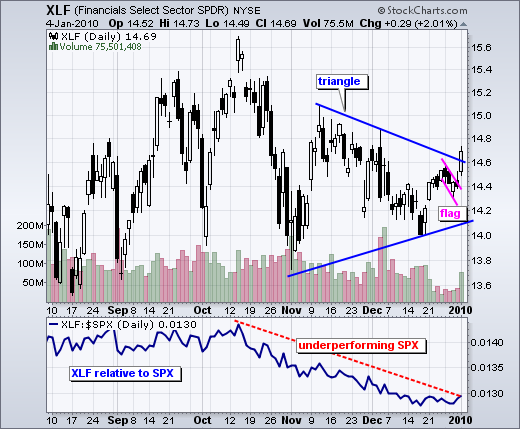
AMGN, ANF, DRYS, GERN, GT, IGT, MOT, S , SII, SVNT, XLF, XL... Read More
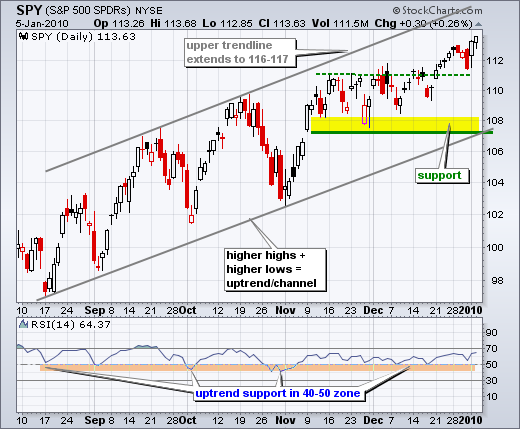
Art's Charts January 05, 2010 at 05:31 AM

With another new 52-week high, SPY affirmed the underlying uptrend. The ETF broke resistance around 111 in late December and this breakout held the first day of 2010. A rising price channel has taken shape over the last five months... Read More
Art's Charts January 04, 2010 at 07:52 AM
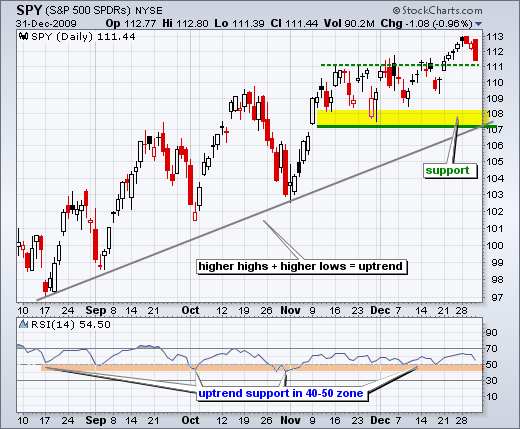
SPY affirmed its uptrend with a break above consolidation resistance at 111 just before Christmas and a new 52-week high last week. The ETF was holding above 112 on New Year's Eve, but late selling pressure pushed SPY below 111.5 by the close... Read More