Art's Charts December 30, 2009 at 02:54 AM
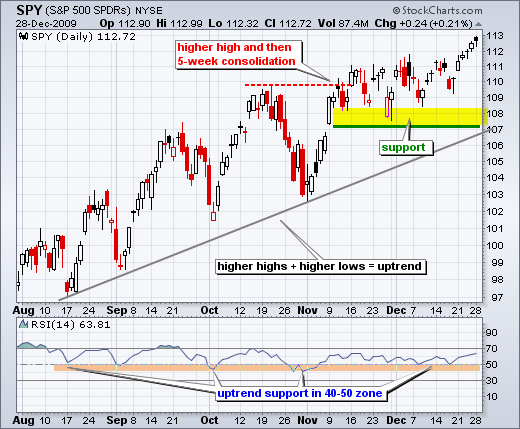
After a five day surge from 110 to 113, the S&P 500 ETF (SPY) took a breather on Tuesday with a small decline. SPY was trading in positive territory in the afternoon, but got hit with a late sell-off that pushed prices into negative territory... Read More
Art's Charts December 29, 2009 at 11:43 AM
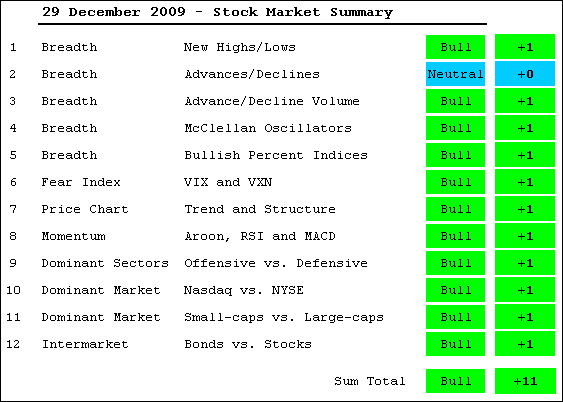
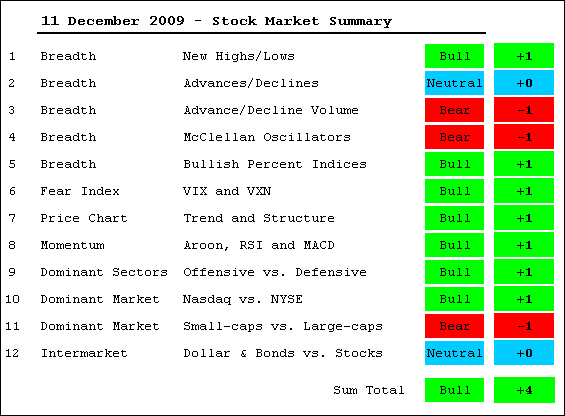
As the market summary table shows, the bulk of the evidence is firmly bullish. In fact, the Nasdaq AD Line is the only negative out there right now and the table is almost all green. The weight of the evidence has favored the bulls since inception (September)... Read More
Art's Charts December 29, 2009 at 09:49 AM
-Evidence remains bullish -Net New Highs expand in December -NYSE AD Line hits 52-week high -Nasdaq AD Volume Line hits 52-week high -McClellan Oscillators surge above 50 -Bullish Percent Indices move higher -Volatility indices move to new lows -Trend and momentum are bullish -Of... Read More
Art's Charts December 29, 2009 at 05:08 AM
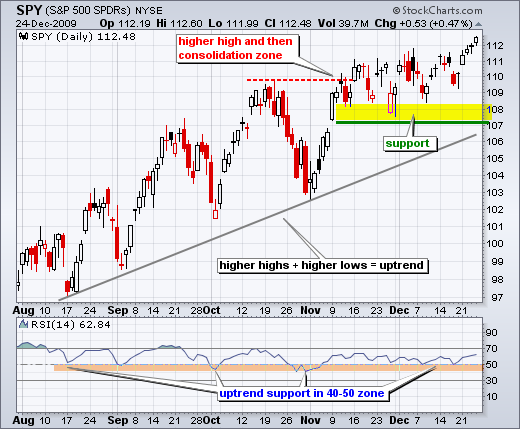
There is no change in SPY as the ETF edged higher on Monday. Trading remains thin, but there are still more buyers than sellers out there... Read More
Art's Charts December 28, 2009 at 07:33 AM
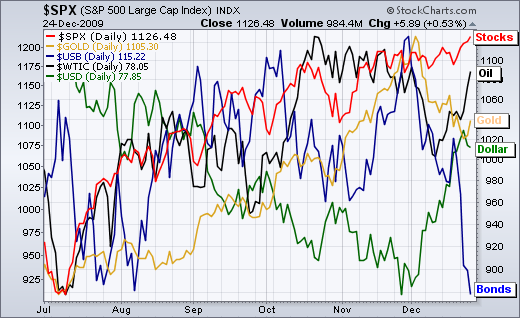
-Bonds breakdown as stocks hit new high -Dollar getting short-term overbought -Gold finds support near broken resistance -Oil recovers after early December drop -Bonds break support with sharp decline ***************************************************************** Dollar gettin... Read More
Art's Charts December 28, 2009 at 05:33 AM

Stocks moved higher with a classic Santa Claus rally last week and the bulls remain in control. Techs and small-caps led the rally as QQQQ and IWM advanced around 5% in the last five trading days... Read More
Art's Charts December 23, 2009 at 03:37 AM
There is no change in the short-term or medium-term picture. Updated charts are shown below. The next commentary will be on Monday, December 28th... Read More
Art's Charts December 22, 2009 at 09:19 AM
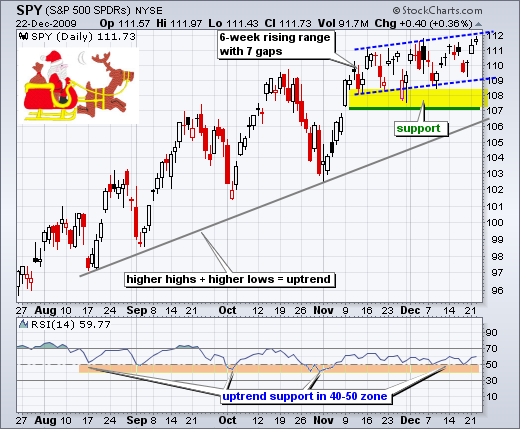
-Six weeks and seven gaps -Homebuilders on the hot seat -Retail SPDR breaks triangle -Oil Service HOLDRs hits resistance -Charts of Interest BOOM, CERN, EBAY, EP, GE , GERN, HCBK, ISIL, LSI, QCOM, SVNT - Click here for the video pag... Read More
Art's Charts December 22, 2009 at 08:29 AM
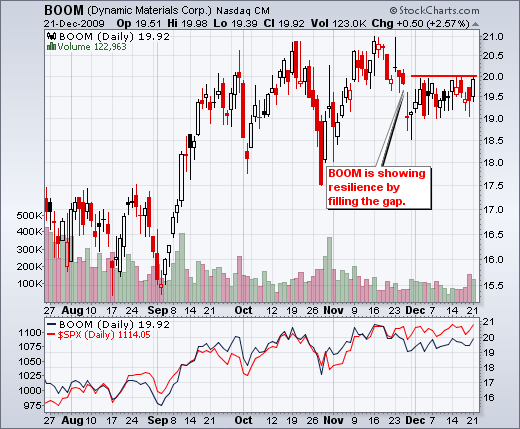
boom, cern, ebay, ep, ge , gern, hcbk, isil, lsi, qcom, svn... Read More
Art's Charts December 22, 2009 at 08:23 AM
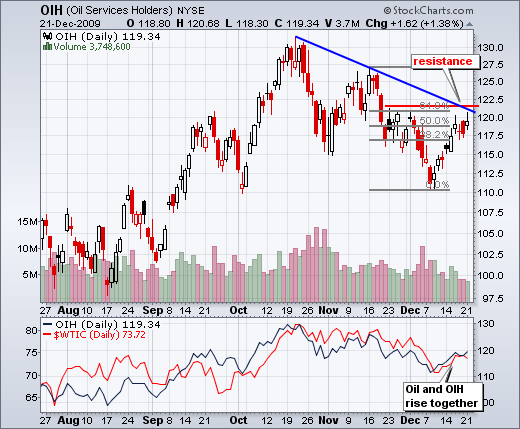
After a rally the last two weeks, the Oil Service HOLDRs (OIH) is bumping up against resistance from the October trendline and the late November highs. Also notice that this bounce retraced around 62% of the decline from mid November to early December... Read More
Art's Charts December 22, 2009 at 08:21 AM
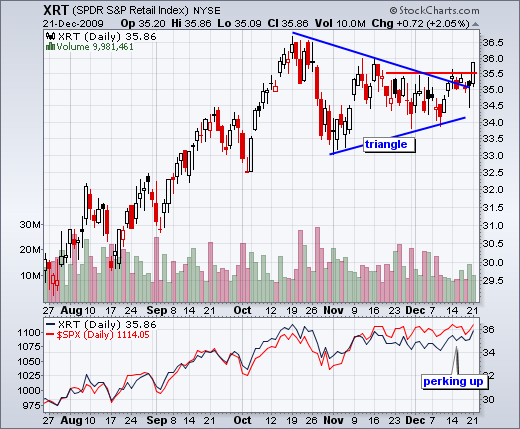
The Retail SPDR (XRT) is getting into the holiday spirit with a triangle breakout on Monday. The ETF has been lagging the broader market over the last two months. Notice that the S&P 500 is trading near a 52-week high, but XRT remains below its mid October high... Read More
Art's Charts December 22, 2009 at 08:20 AM
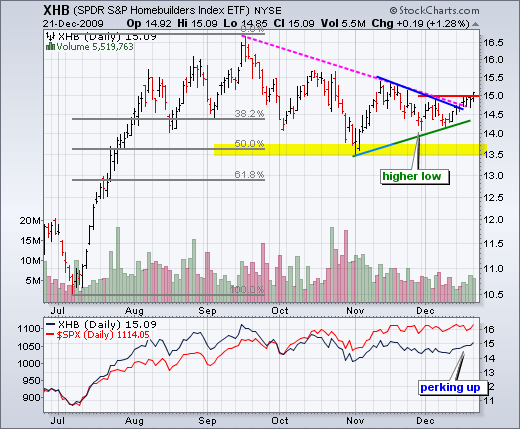
Homebuilding stocks will be in the spotlight with two upcoming reports. Existing Home Sales will be reported on Tuesday (10 AM ET) and New Home Sales will be released on Wednesday at 10 AM ET)... Read More
Art's Charts December 22, 2009 at 04:36 AM
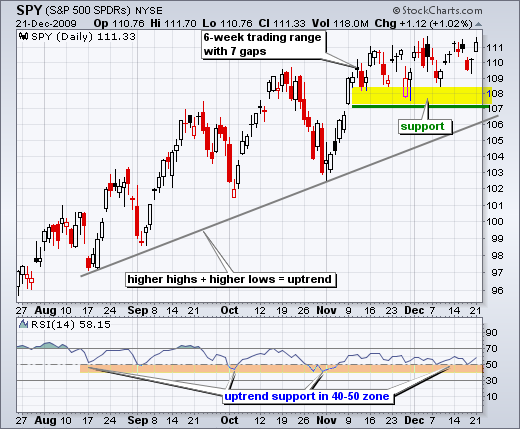
"6 Weeks and 7 Gaps" sounds like the title for a movie with Harrison Ford. SPY moved back to the top of its trading range with a gap up on Monday. Needless to say, there is no change in the medium-term trend (up). With yesterday's close at 111... Read More
Art's Charts December 21, 2009 at 08:43 AM
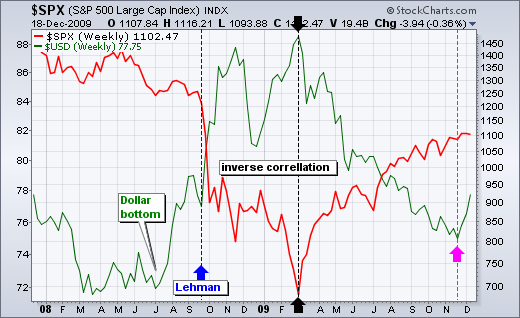
-Dollar surges and stocks hold their gains -Dollar Index hits first resistance zone -Gold hits trendline and retracement support -Oil nears resistance from broken support -Bonds tests very important support zone The relationship between the Dollar and stock is changing... Read More
Art's Charts December 21, 2009 at 06:22 AM
Despite a gap down and sharp decline on Thursday, the S&P 500 ETF (SPY) firmed on Friday and remains in the middle of its 6-week trading range. This means there is no change in the medium-term trend (up)... Read More
Art's Charts December 18, 2009 at 10:48 AM
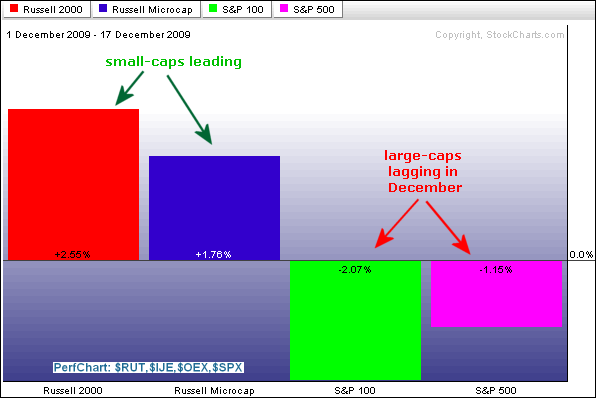
-Bulk of evidence remains bullish -Small-caps outperforming large-caps -SPY and DIA hit retracement resistance -March-December uptrends holding -VIX hits support -Nasdaq AD Volume Line tests October high -NYSE AD Line hits new high -Net New Highs remain positive -Click here for t... Read More
Art's Charts December 18, 2009 at 09:54 AM
The bulk of the evidence remains bullish for the stock market. In fact, I have even seen some strengthening in the bullish case over the past week. The Nasdaq AD Volume Line is challenging its Sep-Oct highs so I upgraded the AD Volume Lines from bearish to neutral... Read More
Art's Charts December 18, 2009 at 09:52 AM
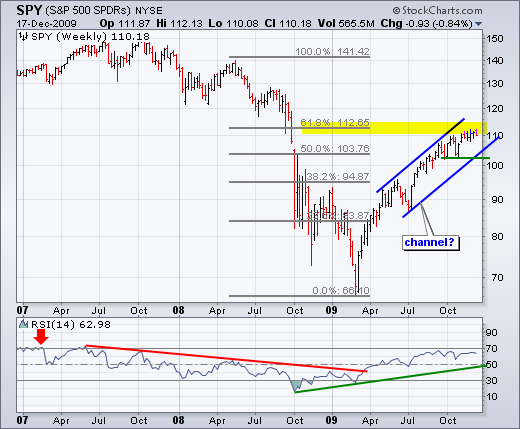
The four major index ETFs remain in clear uptrends on the weekly charts, but all are near potential resistance levels. These charts are grouped in two pairs. First, the S&P 500 ETF (SPY) and the Dow Diamonds (DIA) show similar characteristics... Read More
Art's Charts December 18, 2009 at 09:48 AM
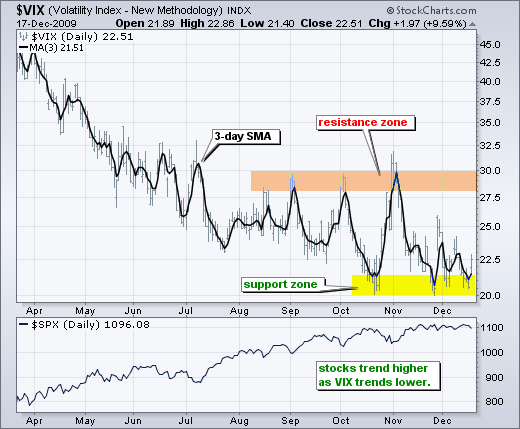
While the S&P 500 and Nasdaq bump resistance from their October-November highs, the S&P 500 Volatility Index ($VIX) and Nasdaq 100 Volatility Index ($VXN) are finding support near their October-November lows... Read More
Art's Charts December 18, 2009 at 09:45 AM
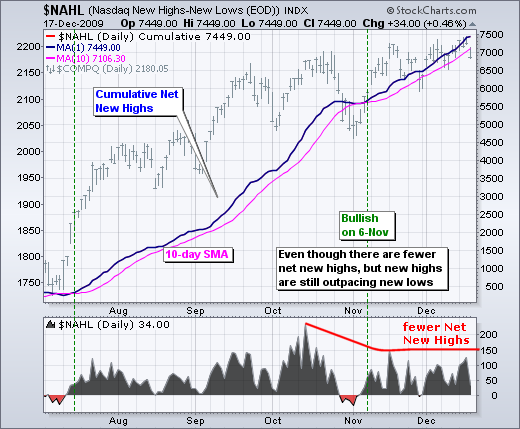
On the bullish side, Net New Highs remain positive for both the Nasdaq and the NYSE. There were fewer Net New Highs in November-December than in October... Read More
Art's Charts December 18, 2009 at 04:24 AM
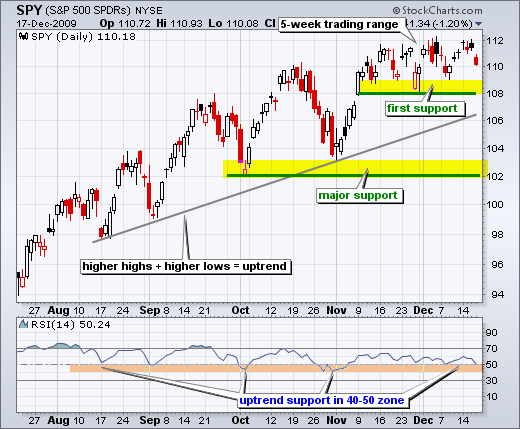
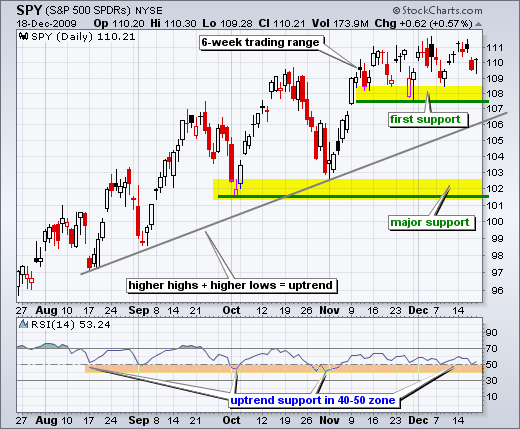
SPY gapped down from trading range resistance and is currently near the mid point of the 5-week high-low range. This area could offer short-term support. The range low is 108.12, the range high is 112.38 and the mid point is 110.25. SPY closed at 110.18 on Thursday... Read More
Art's Charts December 17, 2009 at 03:38 AM
As one might expect, there is no change in the short-term or medium-term trend. SPY gapped up five days ago and formed five indecisive candlesticks. There has been little movement from open to close. Post-open price action has been choppy as the ETF trades near its Nov-Dec highs... Read More
Art's Charts December 16, 2009 at 04:45 AM
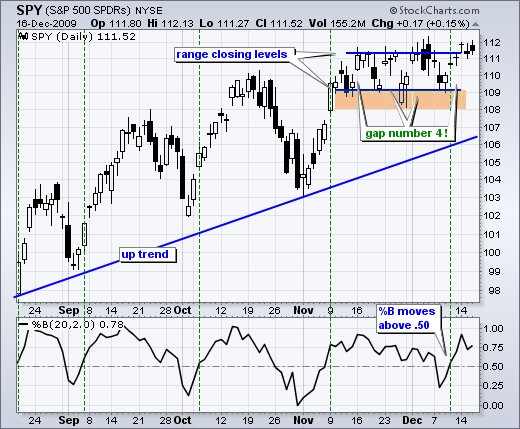
There is no change in the short-term or medium-term trends for the S&P 500 ETF (SPY). The Fed meeting ends today with an announcement expected at 2:15 PM ET. We can expect some volatile swings just before and after the announcement with volatility subsiding around 3PM... Read More
Art's Charts December 15, 2009 at 09:05 AM
-Fed, seasonality and options -A new closing high for SPY -There go small-caps -Key sectors hit new highs -Finance sector continues to stall -Regional Bank SPDR hits Resistance -AAPL, AES, BWA, DELL, DFS, FWLT, JPM, MS, PDCO, PENN, STX, XRX -Click here for the video pag... Read More
Art's Charts December 15, 2009 at 07:50 AM
AAPL, AES, BWA, DELL, DFS, FWLT, JPM, MS, PDCO, PENN, STX, XR... Read More
Art's Charts December 15, 2009 at 07:09 AM
The Fed starts its two day meeting today with its policy statement scheduled for 2:15PM ET on Wednesday. There is usually some above average volatility just before and after the Fed announcement... Read More
Art's Charts December 15, 2009 at 07:00 AM
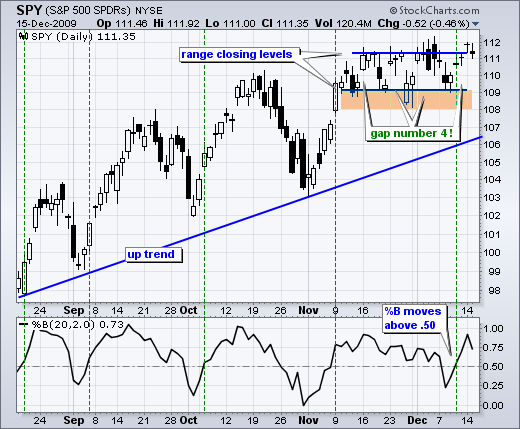
Even though post-open price action has been indecisive the last three days, the S&P 500 ETF (SPY) managed to move higher and close at its highest closing level for 2009. This also means that SPY finally closed above the closing highs from the consolidation... Read More
Art's Charts December 15, 2009 at 06:54 AM
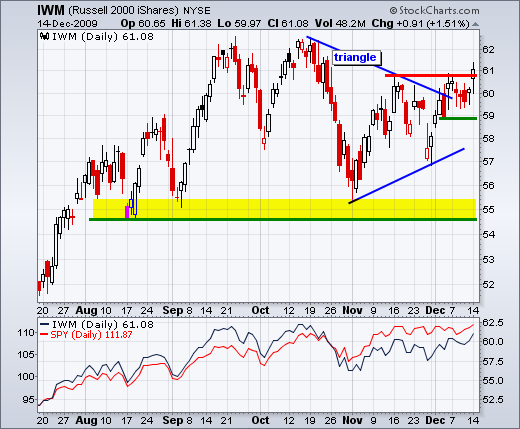
I first wrote about the Russell 2000 ETF (IWM) and the January effect on December 1st. To recap: the January effect is the historical tendency for small-caps to outperform large-caps from mid December to end January... Read More
Art's Charts December 15, 2009 at 06:53 AM
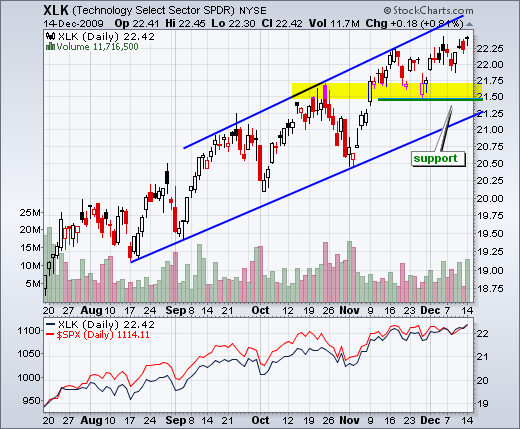
Three of the four offensive sectors moved to new reaction highs. The Industrials SPDR (XLI) led the charge on Monday with a 1.35% gain on the day... Read More
Art's Charts December 15, 2009 at 06:48 AM
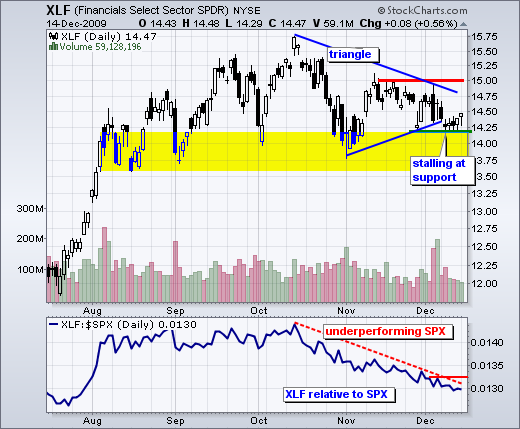
The Financials SPDR (XLF) is also one of the four offensive sectors, but it continues to lag and gets is own special entry. Despite news the Bank of America and Citigroup will repay their TARP money, XLF failed to advance with the rest of the market... Read More
Art's Charts December 14, 2009 at 07:12 AM
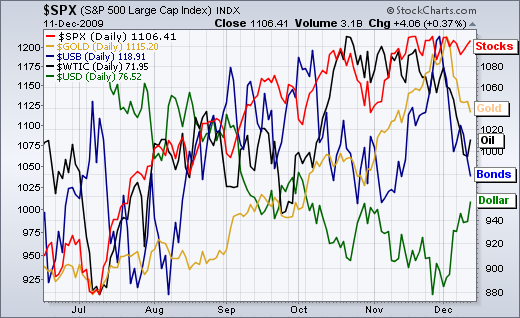
-A trend reversal for the greenback -Gold hits first key retracement -Oil gets an oversold bounce -Bonds plunge to key support zone - Intermarket chart page updated -Further commentary after the jump With its biggest eight-day surge since March, the US Dollar Index ($USD) broke r... Read More
Art's Charts December 14, 2009 at 06:01 AM
There is no real change in the medium-term or short-term situation for SPY. First and foremost, the medium-term trend remains up as SPY recorded a new high for 2009 this month. Second, SPY is consolidating near the October high and holding its gains... Read More
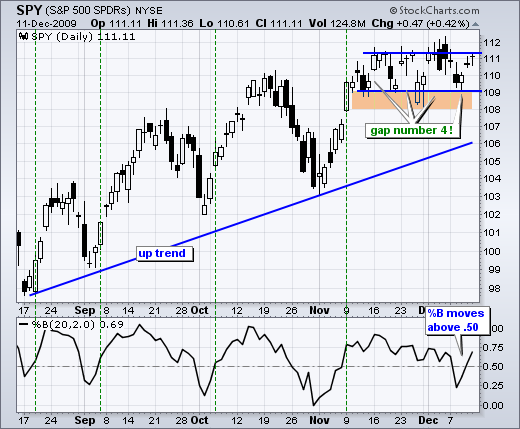
Art's Charts December 11, 2009 at 10:06 AM
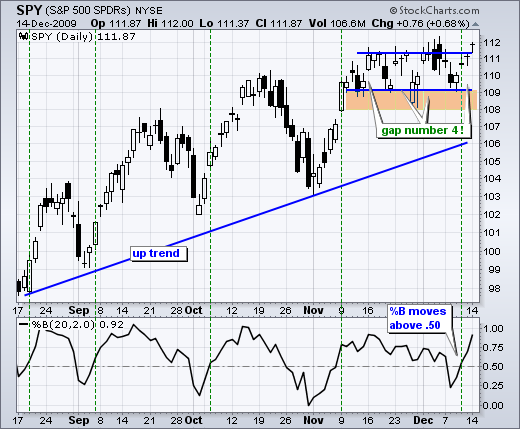
-Gap number 4 for SPY -Uninspiring two-day breadth -Bulk of evidence remains bullish -Bullish% Index divergences -NYSE AD Line hits new high -Net New Highs remain positive -Volatility Remains Low -A clear uptrend for DIA -TLT fails to hold break -A momentum breakout for the Dolla... Read More
Art's Charts December 11, 2009 at 08:28 AM
With stocks trading flat over the last 4-5 weeks, not much has changed for the stock market. There are still more new 52-week highs than new 52-week lows. The NYSE AD Line recorded a new high for the year. Volatility remains subdued as the VIX and VXN test their October lows... Read More
Art's Charts December 11, 2009 at 07:21 AM
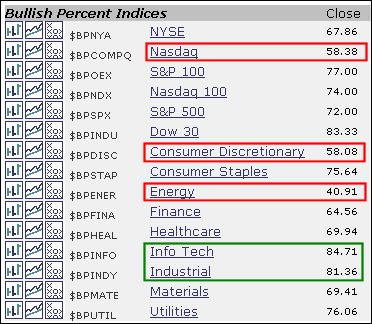
The Bullish Percent Indices tell us the percentage of stocks in an index that have Point & Figure buy signals. There are many ways to interpret these numbers. Analysts can look at the absolute numbers... Read More
Art's Charts December 11, 2009 at 06:07 AM
-Nasdaq AD Line: a serious bearish divergence -Nasdaq AD Volume Line: approaching Sep-Oct highs -Nasdaq McClellan Oscillator: up thrusts have been weak -Nasdaq Net New Highs: more new 52-week highs than new 52-week lows -NYSE AD Line: hit a new high this week -NYSE AD Volume Line... Read More
Art's Charts December 11, 2009 at 05:21 AM
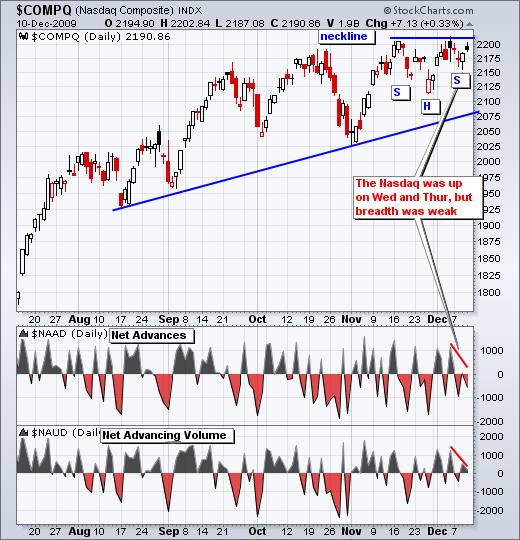
The Nasdaq moved higher the last two days, but Net Advances were barely positive on Wednesday and negative on Thursday. Net Advancing Volume was barely positive on both days... Read More
Art's Charts December 11, 2009 at 05:03 AM
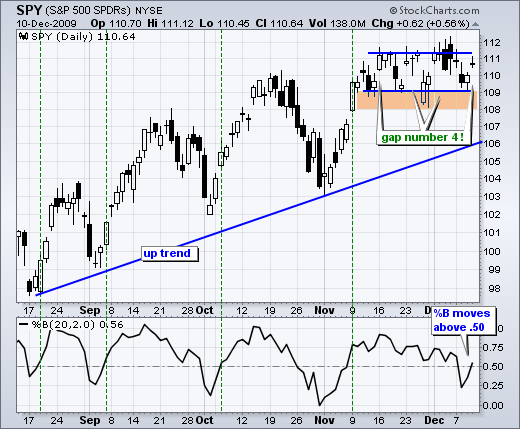
For the fourth time in five weeks, the S&P 500 ETF (SPY) held support with a gap up. Here's what we know. The medium-term trend is up, SPY is consolidating, support is holding and seasonality favors the bulls (especially from December 21st)... Read More
Art's Charts December 10, 2009 at 06:10 AM
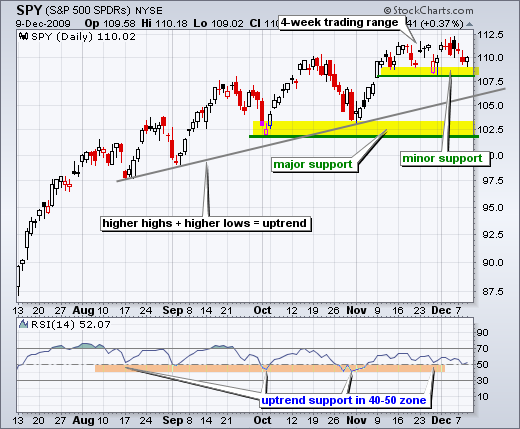
The major index ETFs remain in medium-term uptrends and short-term trading ranges. After a 3-4 day pullback, SPY firmed near the bottom of its four week trading range. The whole world is watching range support for a break that would be negative... Read More
Art's Charts December 09, 2009 at 05:23 AM
SPY moved back below 110 to fill the third gap, but this is not enough to affect the medium-term uptrend. After surging to a new reaction high in mid November, the ETF has been locked in a four point trading range since November 10th... Read More
Art's Charts December 08, 2009 at 08:21 AM
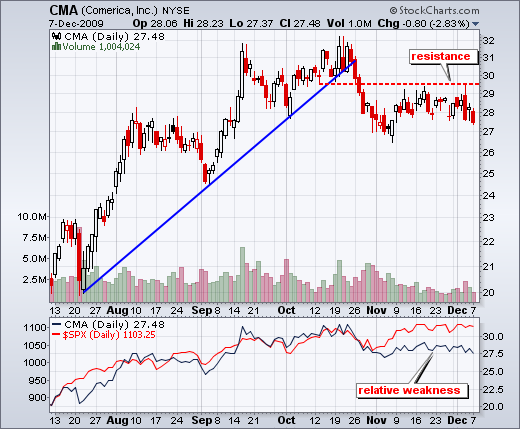
Comerica (CMA), Ebay (EBAY) and Joy Global (JOYG). Comerica (CMA) fails resistance test. After breaking support with a sharp decline in October, CMA rebounded and never came close to its October high. Broken support around 29... Read More
Art's Charts December 08, 2009 at 08:04 AM
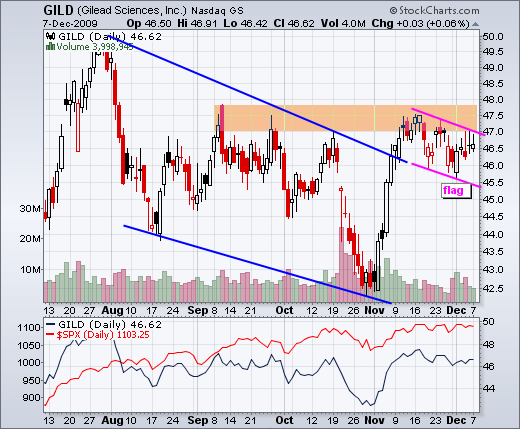
Gilead (GILD), Kroger (KR) and NY Times (NYT) Gilead (GILD) forms a bull flag. After a big surge on good volume in early November, GILD consolidated with a falling flag over the last few weeks. There was a bullish reversal day last Monday, but no follow through with a breakout... Read More
Art's Charts December 08, 2009 at 05:14 AM
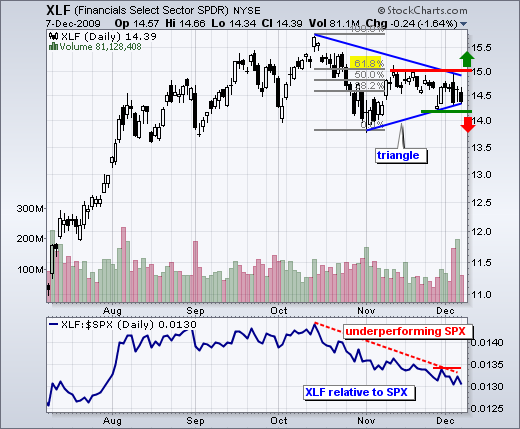
Although the energy and the finance sectors are not related, both are clearly the weakest of the nine sector SPDRs over the last two months. The Financials SPDR (XLF) is more important to the overall market. You know the drill... Read More
Art's Charts December 08, 2009 at 04:54 AM
There is a difference between actual weakness and flat trading, especially within a bigger uptrend. I think we can all agree that SPY has been trending higher since early July, perhaps even since mid March... Read More
Art's Charts December 08, 2009 at 04:01 AM
What makes me think under-invested portfolio managers could keep the market buoyant into yearend? The following quote comes from Jeffrey Saut, Chief Investment Strategist at Raymond James: Net long positions at professional money management firms remain in the 50–60% range, which... Read More
Art's Charts December 07, 2009 at 06:21 AM
Despite closing up on the day, I was not impressed with Friday's price action. A surprisingly small decline (-11K) in non-farm payrolls prompted the bulls into action as SPY opened around 111.84. These gains were fleeting as SPY declined to 110.04 in late morning... Read More
Art's Charts December 07, 2009 at 05:41 AM
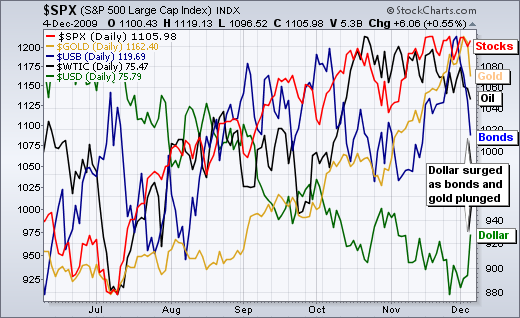
-Dollar surges as bonds and gold plunge -The Dollar is on the verge of a breakout and trend reversal -Gold moves into corrective mode -Extended channel defines downtrend in oil -Bonds remain in overall uptrend despite last week's plunge -Inter-market charts updated Dollar********... Read More
Art's Charts December 04, 2009 at 08:38 AM
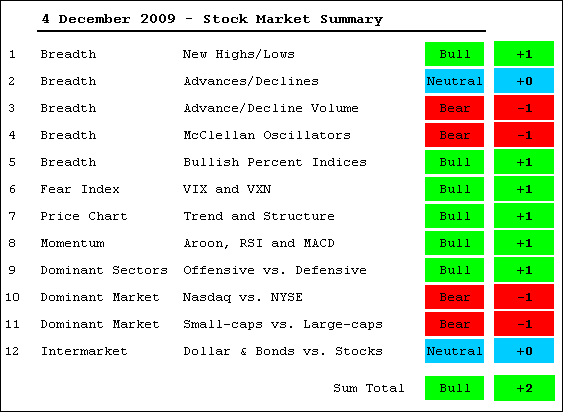
-MT Evidence remains bullish -Net New Highs are fewer, but still positive -Nasdaq AD Line shows weakness in small techs -AD Volume Lines remain below October highs -Consumer discretionary Bullish% Index declines sharply -Volatility remains low -DIA and SPY consolidate near highs ... Read More
Art's Charts December 04, 2009 at 03:44 AM
The S&P 500 ETF (SPY) traded on either side of unchanged most of the day and then got hit with some late selling pressure in the final 20 minutes... Read More
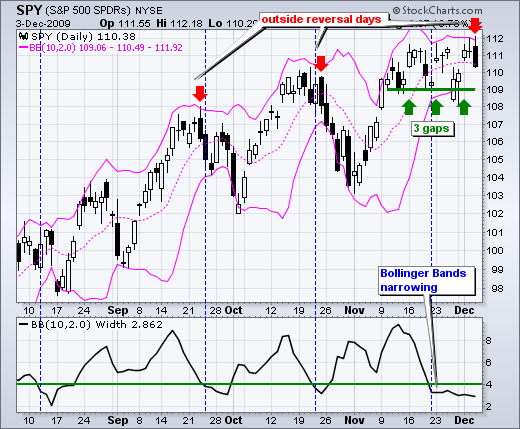
Art's Charts December 03, 2009 at 03:52 AM
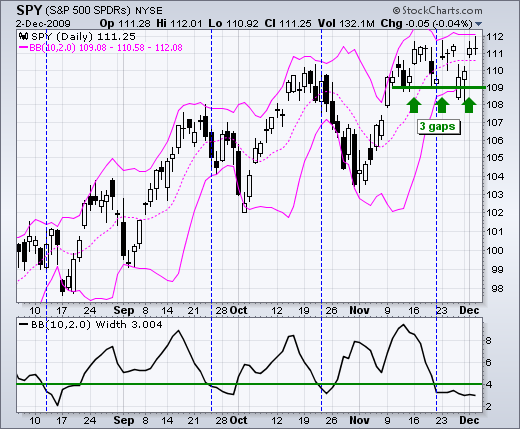
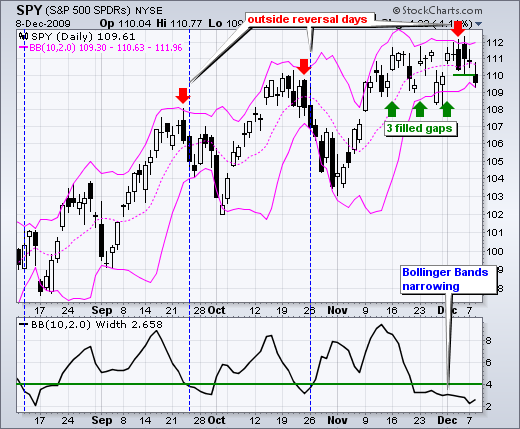
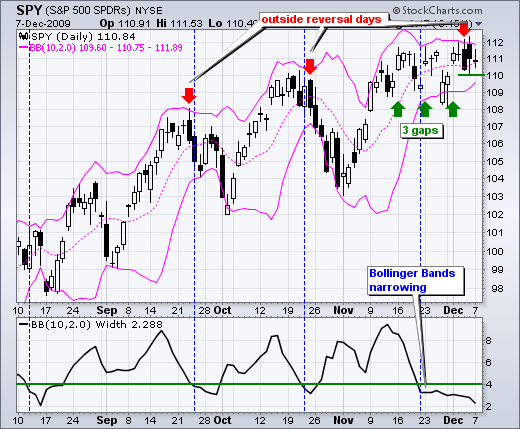
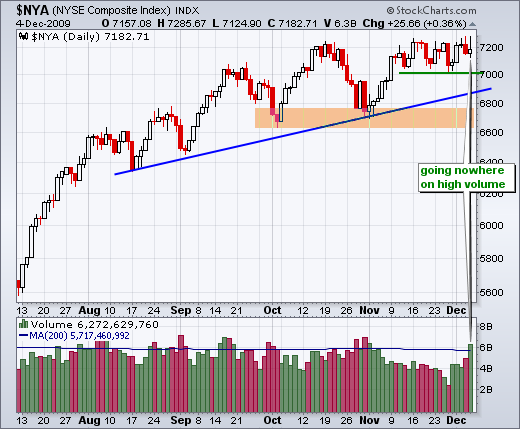
Despite three up gaps in the last three weeks and a volatile range on the 60-minute chart, SPY remains stuck in a trading range with contracting volatility on the daily chart. The chart shows Bollinger Bands (10,2) with Bollinger Band Width in the indicator window... Read More
Art's Charts December 02, 2009 at 07:45 AM
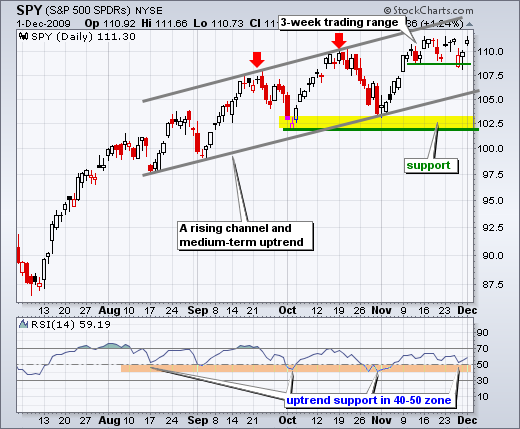
SPY gapped up and held its gains to close above 111 for the fifth time in eleven days. There is no change in the medium-term picture. SPY remains within a rising price channel overall with key support around 102... Read More
Art's Charts December 01, 2009 at 08:43 AM
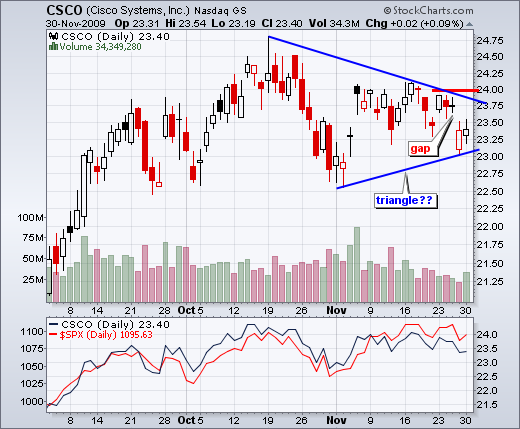
-SPY shows resilience -QQQQ forms falling flag -IWM and the January effect -Key sectors with short-term downtrends -Stocks with bullish setups: CAKE, CHK, CSCO, DELL, INTC, NVDA and OMC -Click here for the video pag... Read More
Art's Charts December 01, 2009 at 07:54 AM
A number of stocks, ETFs and indices gapped down on Friday and then firmed on Monday. Friday's gap and decline endorsed the bearish case, but firmness on Monday shows indecision. The ability to fill Friday's gap would be considered bullish... Read More
Art's Charts December 01, 2009 at 06:30 AM
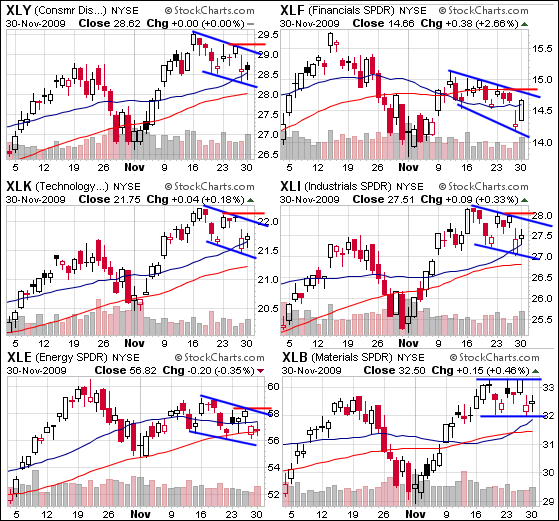
On the CandleGlance charts, the four offensive sectors sport falling consolidations over the last 2-3 weeks... Read More
Art's Charts December 01, 2009 at 05:58 AM
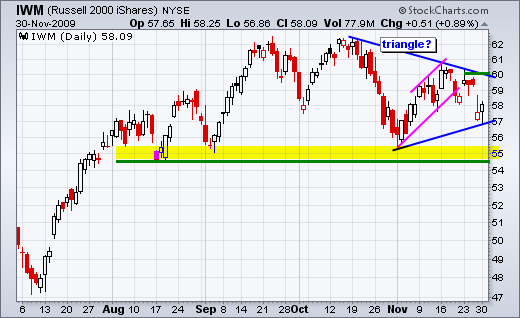
While the rising flag (pink) and support break at 58 were bearish for IWM, we must always be prepared for the unexpected when dealing with the stock market... Read More
Art's Charts December 01, 2009 at 05:57 AM
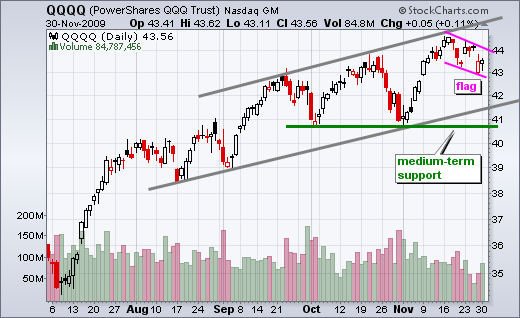
There is no denying the uptrend in QQQQ over the last few months. Even with the pullback over the last two weeks, QQQQ is within spitting distance of its 2009 high. Moreover, this pullback looks like a falling flag, which is a bullish consolidation... Read More
Art's Charts December 01, 2009 at 05:15 AM
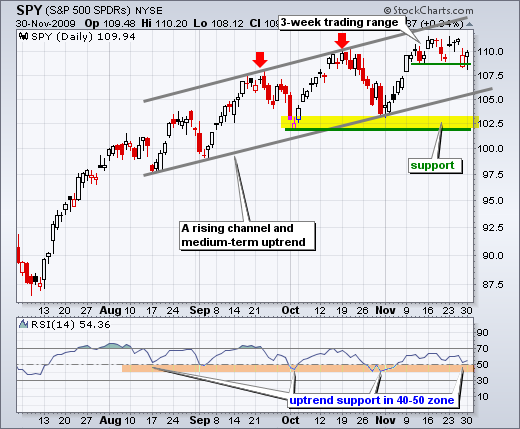
Despite negative ramblings with Dubai and black Friday, the S&P 500 ETF (SPY) is showing resilience on the daily chart. SPY gapped down on Friday, but closed well above its open to form a white candlestick. Even though Monday's candlestick shows an intraday dip to 108... Read More