Art's Charts March 31, 2011 at 04:25 AM
Stocks remain strong. SPY is up 5.68% the last 10 days. A small indecisive candlestick formed after a gap up on the open. Even though potential resistance from the February high is close and stocks are short-term overbought, there is simply no let up in buying pressure... Read More
Art's Charts March 31, 2011 at 04:14 AM
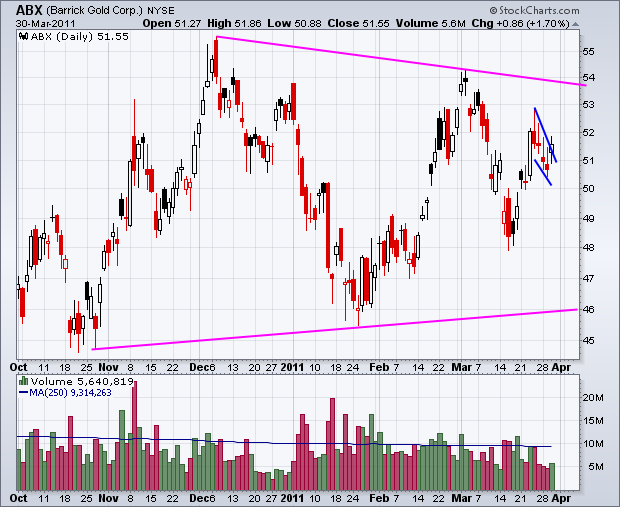
ABX Forms Bull Flag. AEO Surges to Resistance. FLEX Flexes its Muscles. Plus AMRK, BSX, LLY and STT. ----------------------------------------------------------------------------- This commentary and charts-of-interest are designed to stimulate thinking... Read More
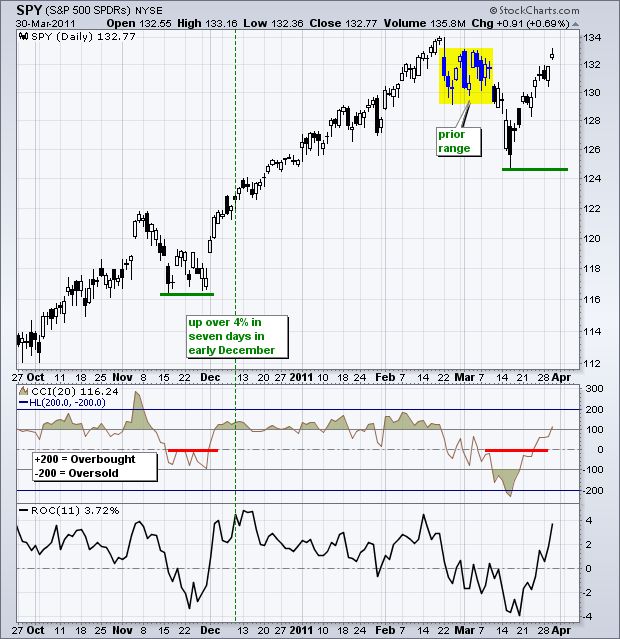
Art's Charts March 30, 2011 at 04:00 AM
"Don't fight the Tape" is an old Wall Street adage. It is as true today as it was when Jesse Livermore traded in the bucket shops. First and foremost, the overall trend on the daily and weekly charts is up and has been up for some time... Read More
Art's Charts March 29, 2011 at 05:49 AM
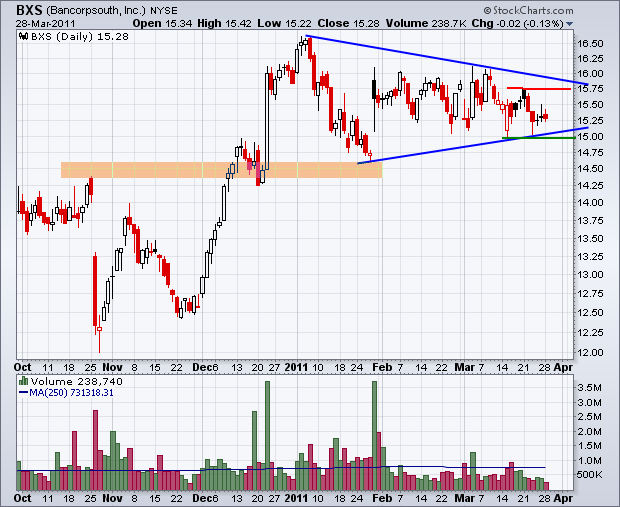
BSX Forms Long Triangle. ENR Gaps Up off Support. FITB Consolidates near Support Zone. Plus HBI, IBOC, SLAB and TRMK. ----------------------------------------------------------------------------- This commentary and charts-of-interest are designed to stimulate thinking... Read More
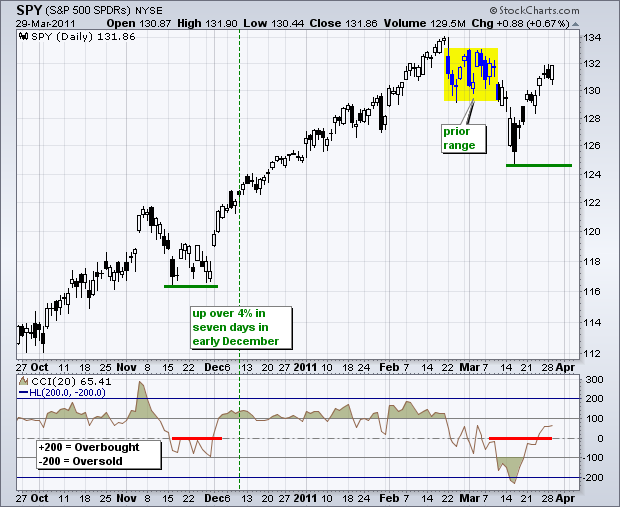
Art's Charts March 29, 2011 at 02:59 AM
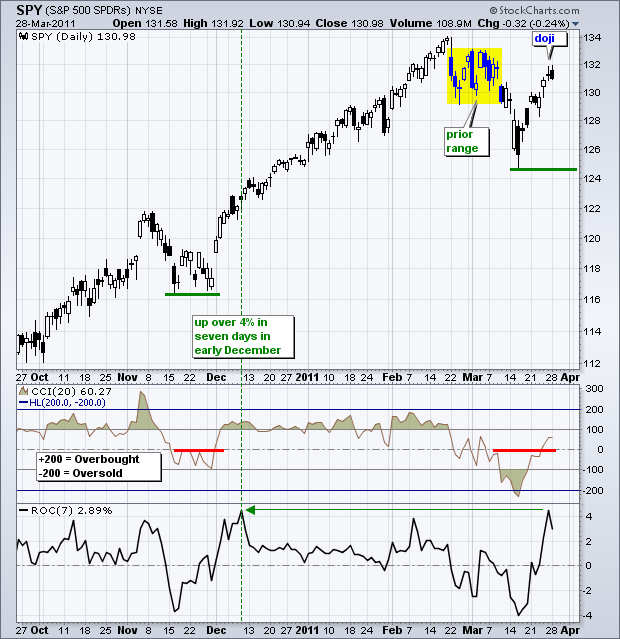
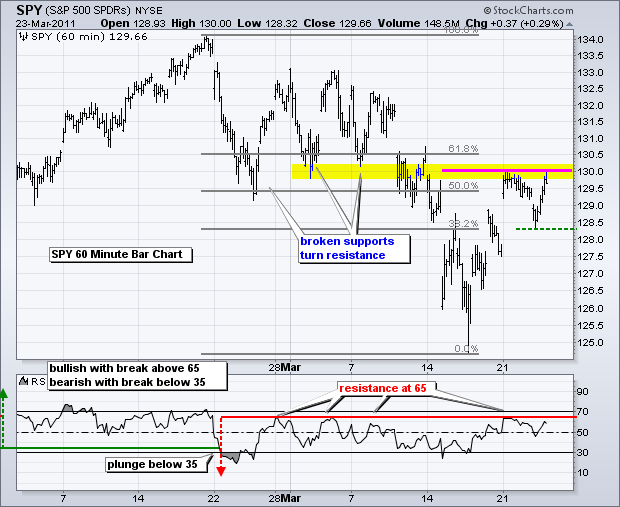
The medium-term trend has been up since early September and the short-term trend turned up again with last week's break above 130. After a 4.51% run the prior seven days, the S&P 500 ETF (SPY) became short-term overbought and is now showing signs of indecision... Read More
Art's Charts March 28, 2011 at 07:03 AM
With a 4.51% run the last seven days, the S&P 500 ETF (SPY) is short-term overbought and showing signs of indecision. Chartists do not need a momentum oscillator to figure out that SPY is short-term overbought. This 7-day rally is the strongest since the first week of December... Read More
Art's Charts March 25, 2011 at 07:11 AM
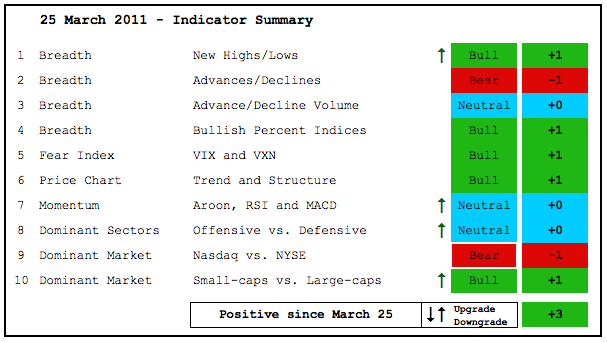
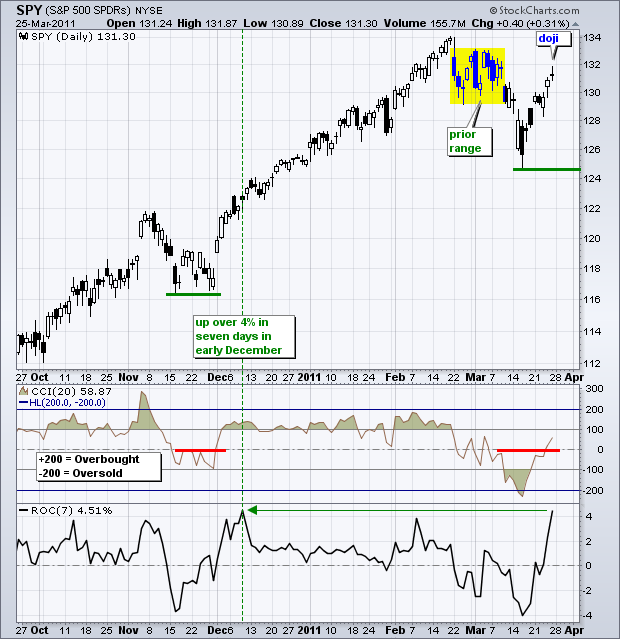
Even though the indicator summary turned negative last week, I still viewed the recent decline as a correction within a bigger uptrend. We have yet to see a major topping pattern evolve and the market was entitled to a correction after a big run from late August to February... Read More
Art's Charts March 25, 2011 at 03:58 AM
It was small-caps powering the market higher on Monday and techs powering stocks higher on Thursday. Even though these two key groups are playing tag-team, the market is benefitting from strength in both groups this week... Read More
Art's Charts March 24, 2011 at 05:27 AM
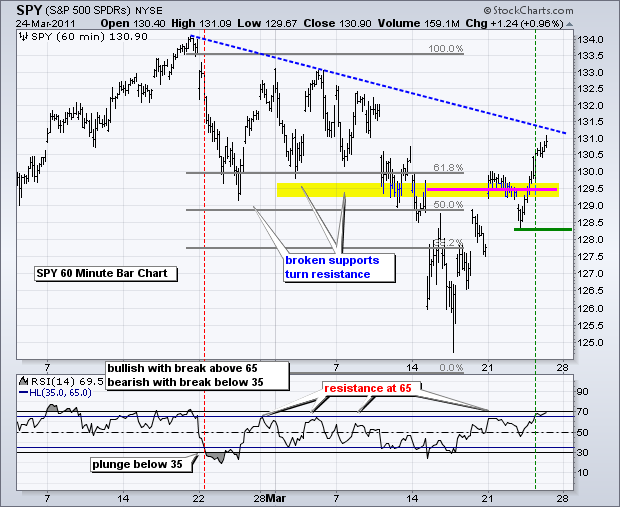
The bulls simply refuse to give up. SPY opened lower with a gap below 129, but the bulls quickly entered the market and pushed stocks higher. SPY surged back to Monday's high, DIA exceeded Monday's high and tech stocks showed relative strength on Wednesday... Read More
Art's Charts March 24, 2011 at 05:23 AM
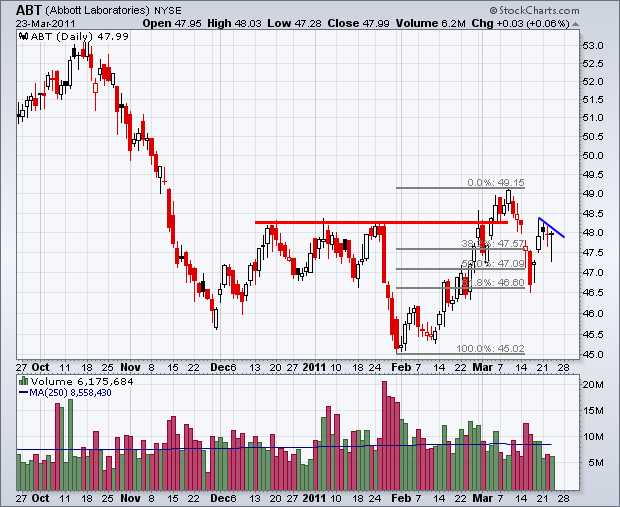
ABT Bounces off Key Retracement. ACI Challenges Resistance. MSFT Breaks Wedge Trendline. Plus ATVI, DELL, F, XLF, XRT ----------------------------------------------------------------------------- This commentary and charts-of-interest are designed to stimulate thinking... Read More
Art's Charts March 23, 2011 at 05:16 AM
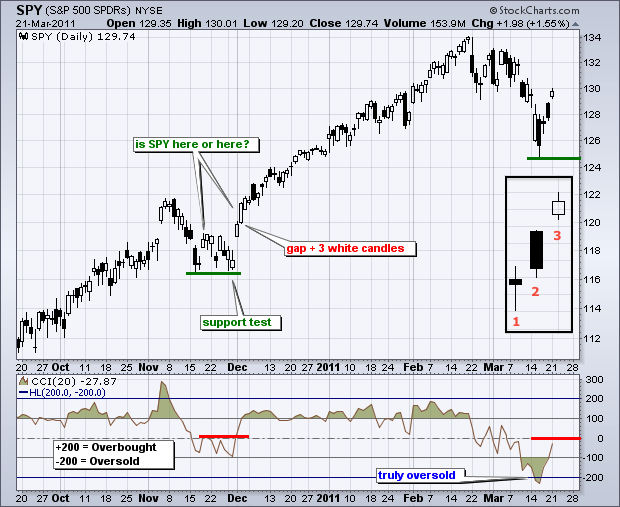
On the daily chart, SPY surged from ±125 to ±130 with two black candlesticks and a small white candlestick. There were three strong opens, but the ETF moved lower after the first two gaps (Thursday-Friday) and barely advanced after Monday's gap... Read More
Art's Charts March 22, 2011 at 06:07 AM
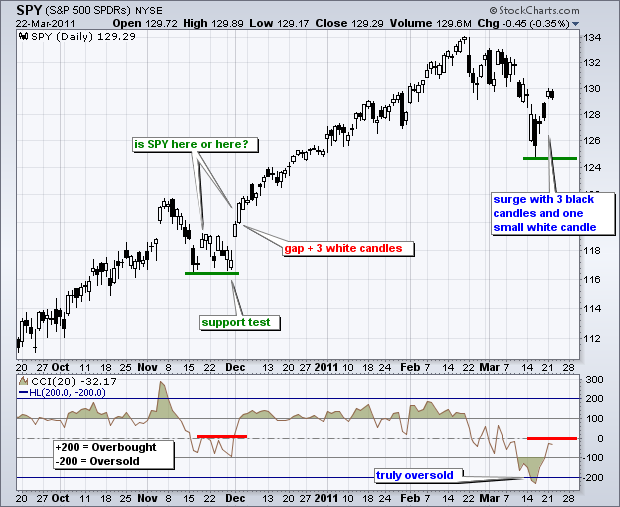
SPY surged over the last three days, but the last three candlesticks show hesitation that could foreshadow a test of last week's lows. Looking back at November, we can see a gap and then a test of the mid November lows with a pullback later that month... Read More
Art's Charts March 22, 2011 at 06:04 AM
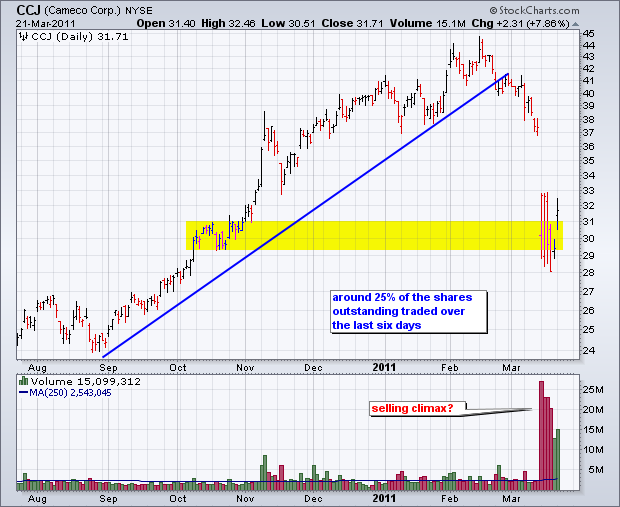
CCJ Trades 25% of Float. CL Surges off Gap Support. CRM Firms at Key Retracement. Plus DHI, F, NVDA, RHT and X ----------------------------------------------------------------------------- This commentary and charts-of-interest are designed to stimulate thinking... Read More
Art's Charts March 21, 2011 at 05:21 AM
Even though the indicator summary turned negative on Friday (minus 3) for the first time since September 3rd, the decline over the last four weeks is still considered a correction within a bigger uptrend. This 6% decline follows a 13... Read More
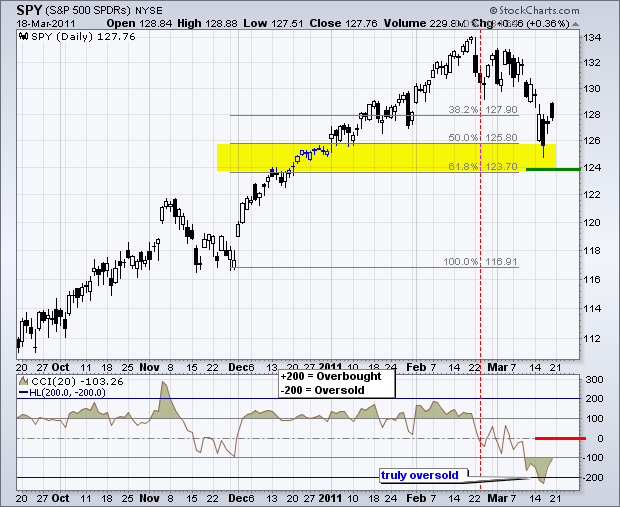
Art's Charts March 18, 2011 at 07:21 AM
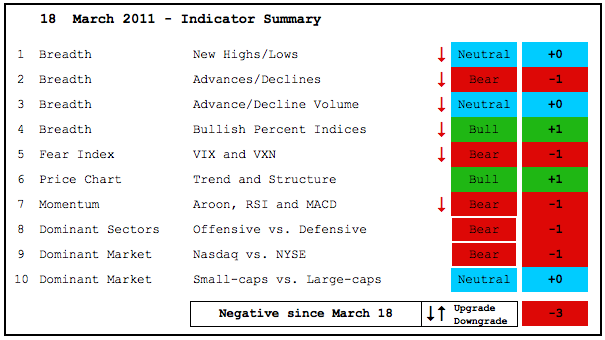
After a positive run from September 3rd, the indicator summary turned negative this week with six indicator downgrades. At this point, I still view the recent decline as a correction within a bigger uptrend... Read More
Art's Charts March 18, 2011 at 06:14 AM
The analysis in this daily report on Art's Charts is short-term oriented, which can be from a few days to a few weeks. Medium and long-term analysis can be found in the Market Message, which is produced by John Murphy and myself... Read More
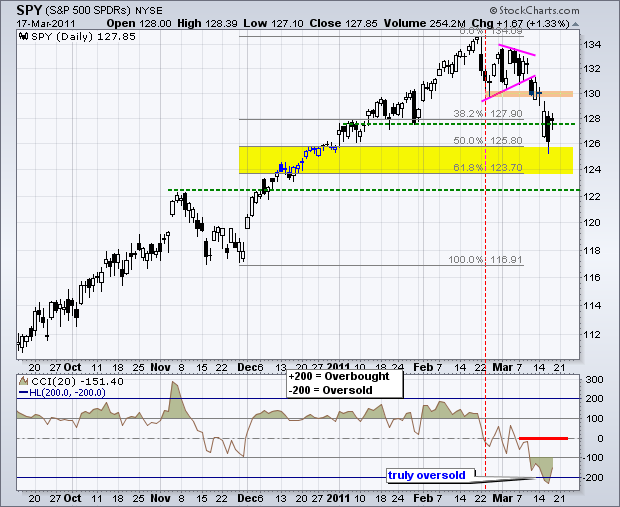
Art's Charts March 17, 2011 at 07:09 AM
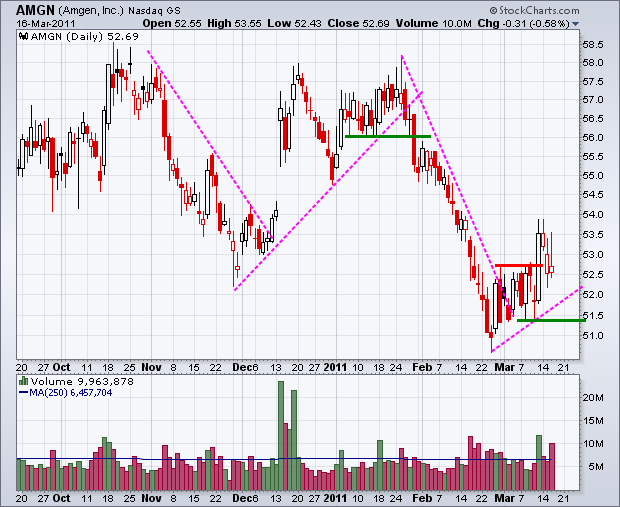
AMGN Holds Trendline Break. ANF Forms Small Pennant. FFIV Battles Support. Plus DHI, NVDA and OLN. ----------------------------------------------------------------------------- This commentary and charts-of-interest are designed to stimulate thinking... Read More
Art's Charts March 17, 2011 at 06:27 AM
There is no change to the short-term evidence, which remains bearish. However, the major index ETFs are oversold again and near support levels that could give way to a bounce... Read More
Art's Charts March 16, 2011 at 04:31 AM
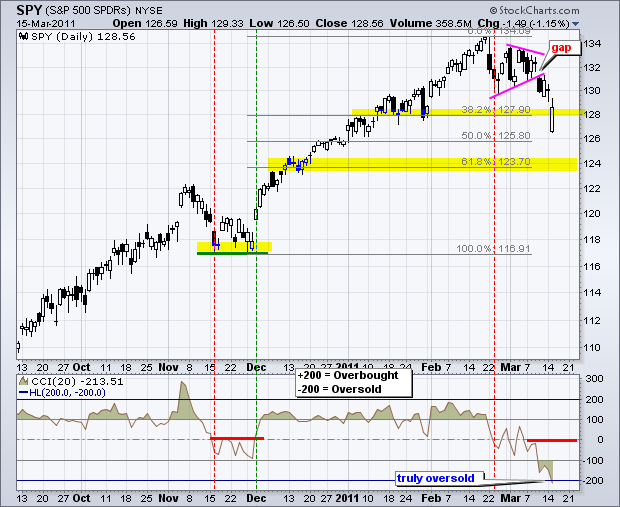
The S&P 500 ETF (SPY) opened with a huge gap down, but rallied after this gap to form a long white candlestick. Notice that the ETF opened in the 38-50% retracement zone and closed above the 38% retracement mark. This move reinforces the 128 area as the first support zone... Read More
Art's Charts March 15, 2011 at 04:51 AM
There is no change in the overall assessment. The majority of short-term evidence remains bearish. Bearish evidence started building when RSI on the 30-minute chart plunged below 30 on February 22nd... Read More
Art's Charts March 15, 2011 at 04:47 AM
Charts: AWR Bounces off Support. ERTS Forms Bull Wedge. WHR Forms Bear Flag. Plus HOG, IR, SCMR, THQI and USG ----------------------------------------------------------------------------- This commentary and charts-of-interest are designed to stimulate thinking... Read More
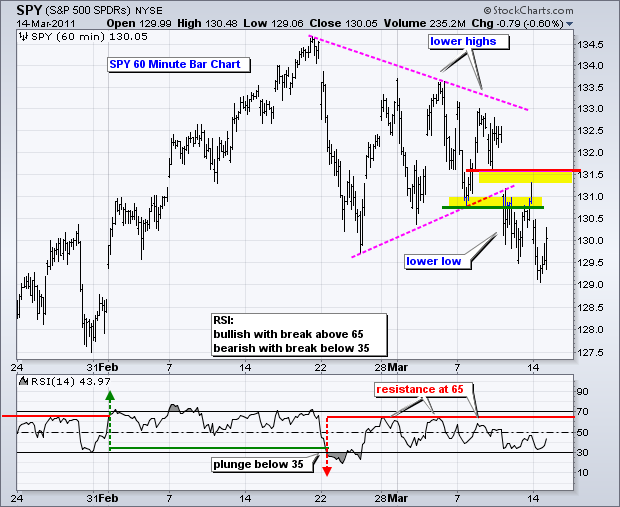
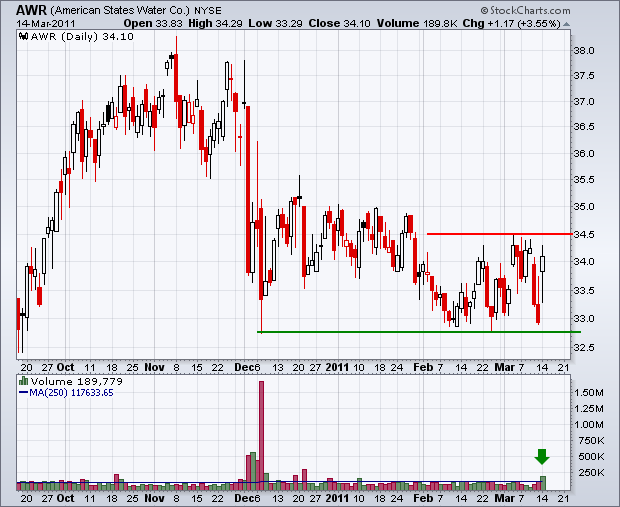
Art's Charts March 14, 2011 at 06:20 AM
The majority of the short-term evidence remains bearish. Bearish evidence started building when RSI on the 30-minute chart plunged below 30 on February 22nd. Despite a few sharp bounces, the indicator never made it back above 65 and remains in bear mode... Read More
Art's Charts March 11, 2011 at 04:53 AM
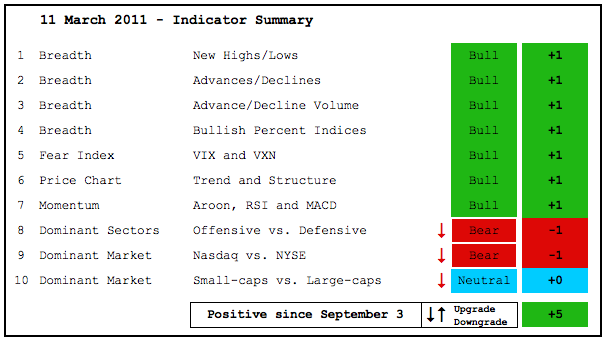
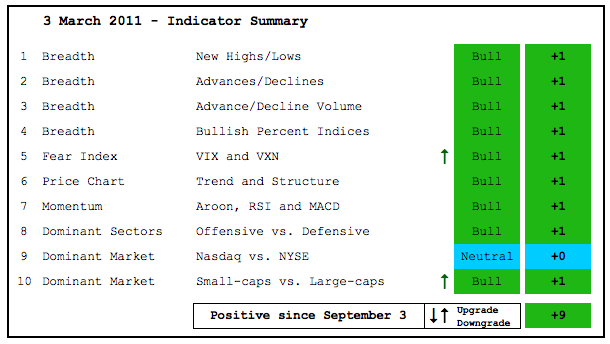
The indicator summary is a medium-term vehicle designed to measure an array of indicators. The sum total identifies periods of strength when positive and weakness when negative. This sum total is not a leading indicator and not immune to whipsaws... Read More
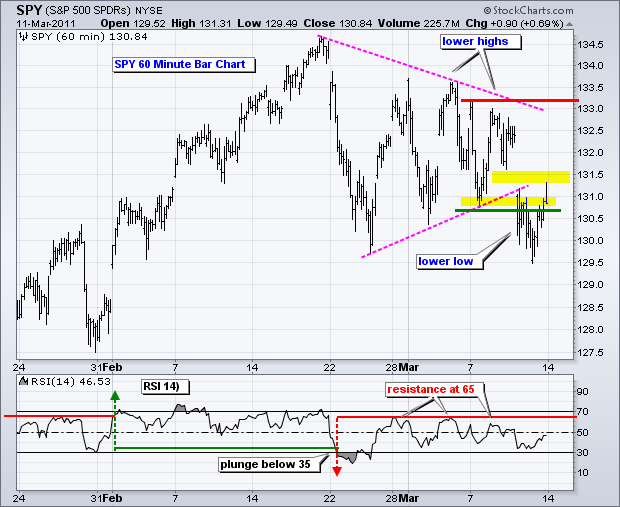
Art's Charts March 11, 2011 at 03:55 AM
The final piece of the short-term puzzle finally came through as SPY broke support with a gap and sharp decline. RSI was already in bear mode after a plunge below 30 and three failures below 70... Read More
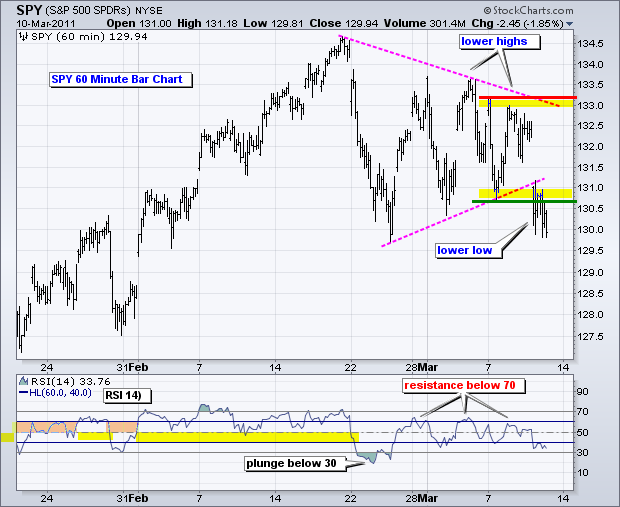
Art's Charts March 10, 2011 at 04:51 AM
There appear to be some changes afoot in the intermarket arena that could have a negative effect on stocks. We already know about the surge in oil and commodity prices... Read More
Art's Charts March 10, 2011 at 04:47 AM
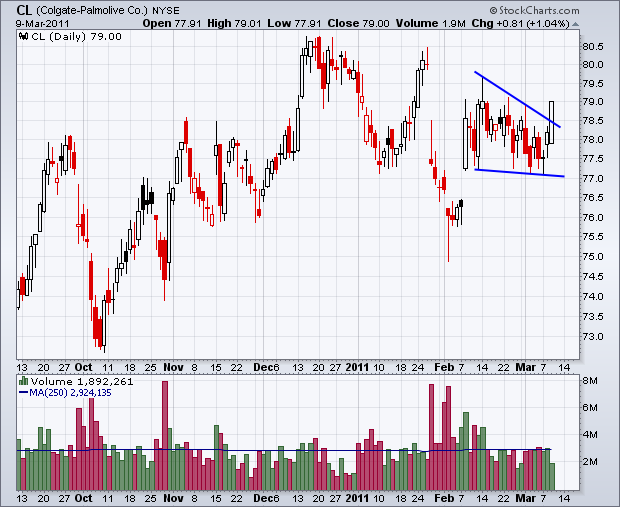
CL Breaks Surges above Wedge Trendline. IMN Forms Bullish Consolidation. SPG Consolidates after Sharp Decline. Plus JNJ and LIFE... Read More
Art's Charts March 09, 2011 at 06:18 AM
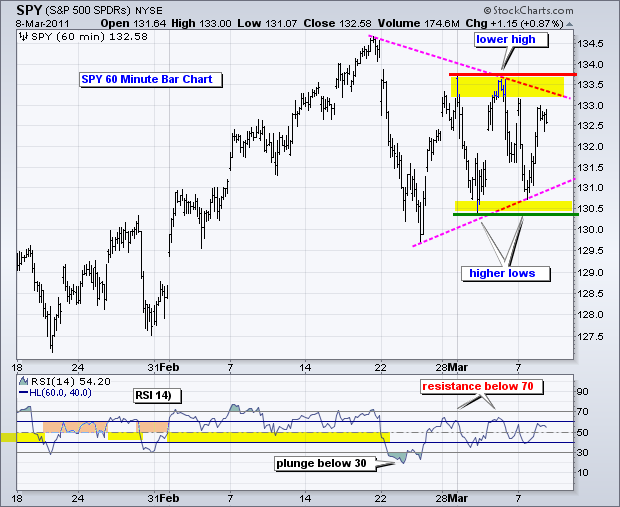
Even though the bulk of the short-term evidence has shifted to the bears, the bulls refuse to give way as the S&P 500 ETF (SPY) holds support. Four out of four breadth indicators moved below their bearish thresholds... Read More
Art's Charts March 08, 2011 at 05:41 AM
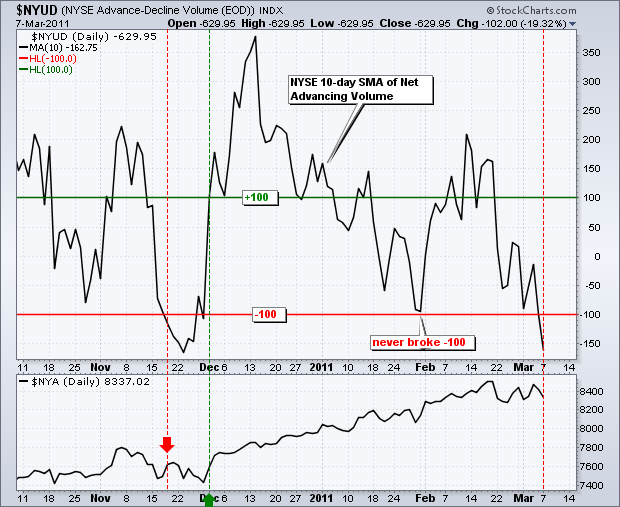
With another day of selling pressure, the 10-day SMAs for the NYSE Net Advances ($NYAD) and NYSE Net Advancing Volume ($NYUD) moved below -100. These indicators now join the 10-day SMAs for Nasdaq Net Advances ($NAAD) and Nasdaq Net Advancing Volume ($NAUD) with bearish signals... Read More
Art's Charts March 08, 2011 at 05:31 AM
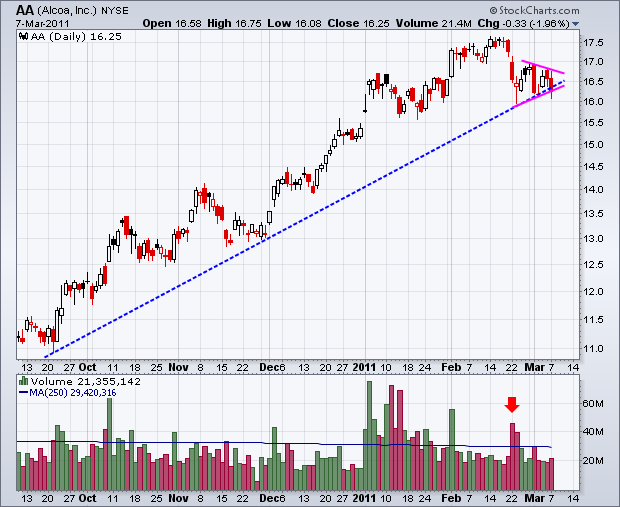
AA Forms Bearish Pennant. ANF Fails at Resistance, BBBY Forms Bearish Flag. Plus ANN, BAC, BBBY, GME, JCOM, MCHP, S and STEC This commentary and charts-of-interest are designed to stimulate thinking... Read More
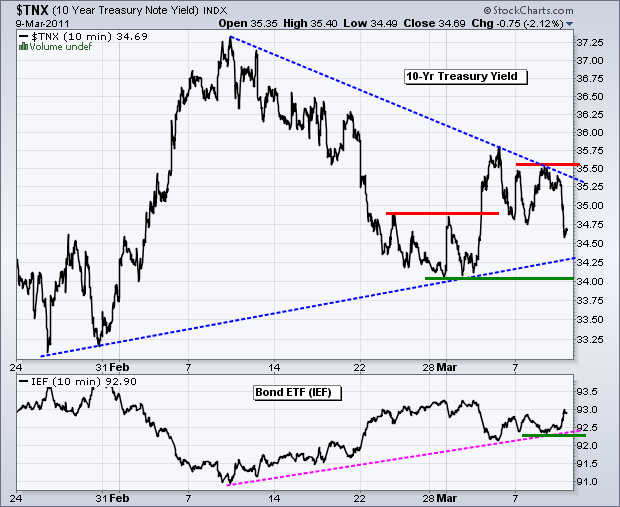
Art's Charts March 07, 2011 at 04:36 AM
One must wonder how stocks can continue to gain in the current environment. Oil, gold and the Euro are going to the moon. Bonds broke down last week to signal a resumption of their long-term downtrend, which means interest rates are heading higher... Read More
Art's Charts March 04, 2011 at 08:50 AM
Even though stocks may seem overbought and ripe for a correction, there are simply no signs of concerted selling pressure in the market right now. We saw a 3-4 day decline last week and a one day decline on Monday, but both were followed by sharp advances... Read More
Art's Charts March 04, 2011 at 04:00 AM
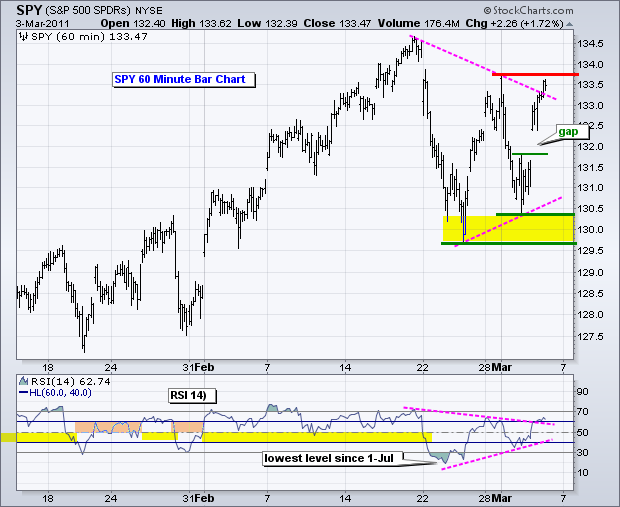
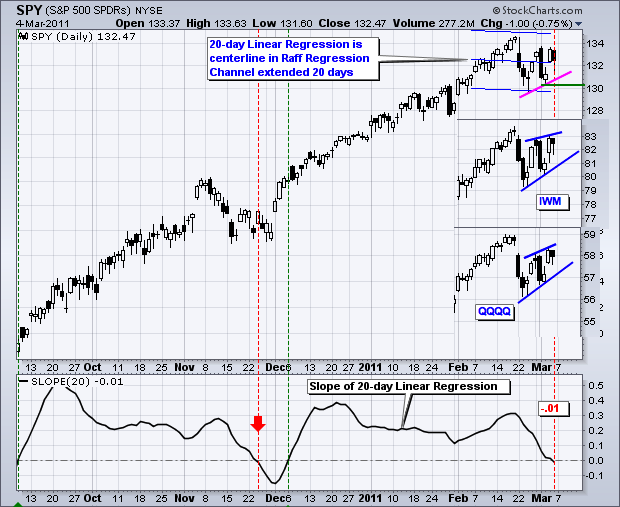
The bulls are simply not to be denied. Despite a gap down and sharp decline last week as well as a bearish engulfing on Monday, stocks firmed above last week's low and SPY surged above 133 on Thursday. This is why I look at an array of indicators to assess the short-term trend... Read More
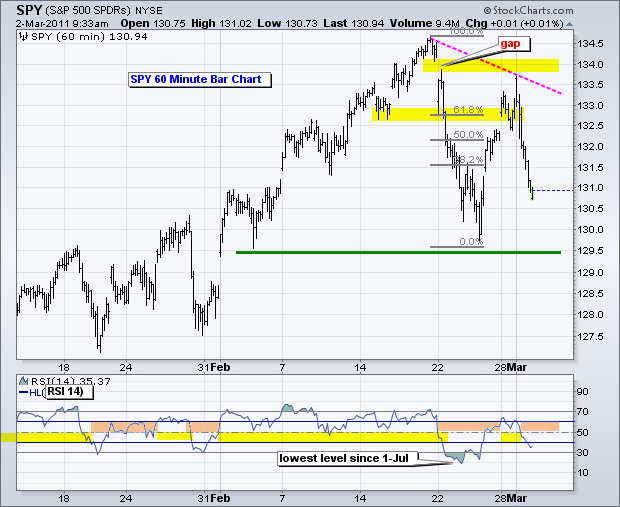
Art's Charts March 03, 2011 at 03:24 AM
With a little firmness on Wednesday, we can draw a tentative trendline extending up from last week's low to form a volatile triangle over the last 8 trading days. Technically, the short-term trend is still up... Read More
Art's Charts March 03, 2011 at 03:22 AM
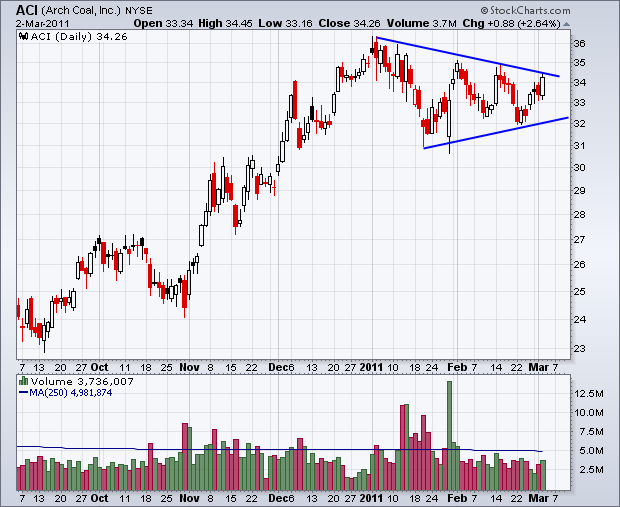
ACI Forms Triangle. AEO Firms at Key Retracement. LOGI Consolidates After Breakout. Plus GILD,HAS,IGT ----------------------------------------------------------------------------- This commentary and charts-of-interest are designed to stimulate thinking... Read More
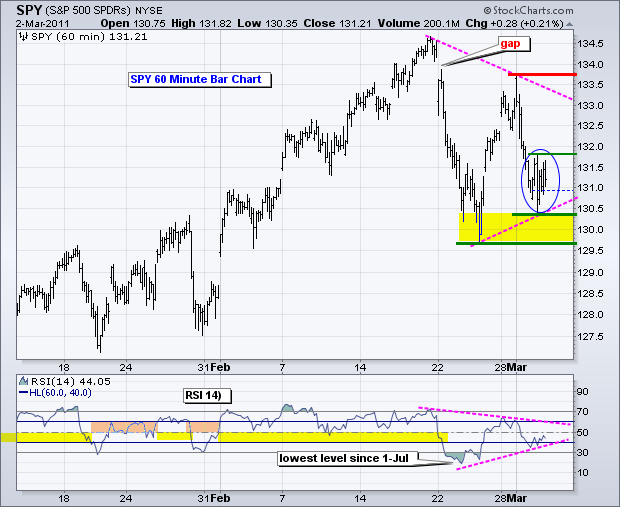
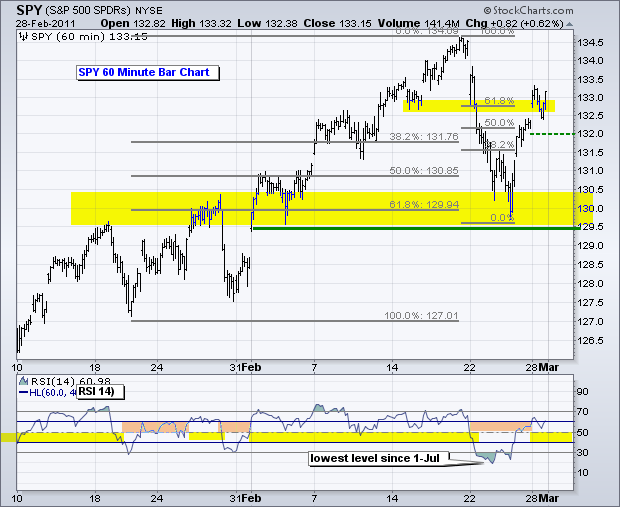
Art's Charts March 02, 2011 at 05:50 AM
The 7-month streak of first day-of-month gains was broken on March 1st as stocks declined rather sharply. SPY surged to resistance around 132.5-133 on Monday and opened above 133.5 on Tuesday. This early gap did not hold as the ETF quickly reversed and moved sharply lower... Read More
Art's Charts March 01, 2011 at 05:01 AM
The magical first day of the month is upon us. Among others, bespokeinvest.com notes that the S&P 500 has gained 14 of the last 16 times on the first day of the month. The last two down days were the first days of June and July 2010. On average the S&P 500 has gained 1%... Read More
Art's Charts March 01, 2011 at 04:56 AM
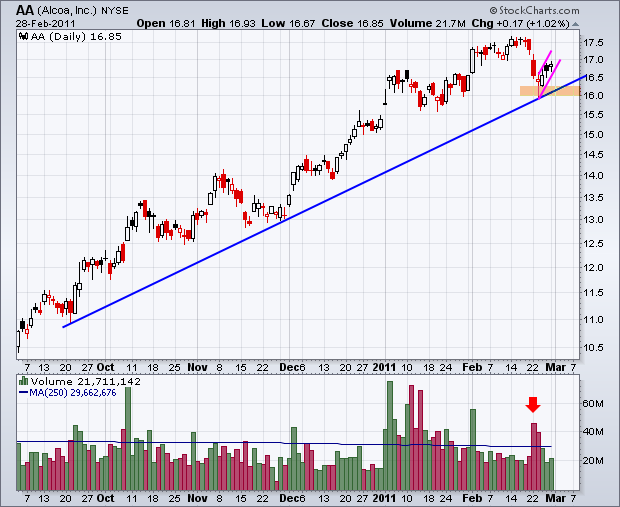
AA bounces on low volume. GOOG trades flat for 4 months. GS holds gap down. Plus AKS,F,ROL,RTN ----------------------------------------------------------------------------- This commentary and charts-of-interest are designed to stimulate thinking... Read More