Art's Charts May 31, 2019 at 09:34 AM

Key Moving Average Turns Lower. Mid-caps Trigger Bearish Breadth Signal. Small-caps Lead New Low Expansion. Four New Signals on Sector Table. Risk Aversion Indicators Surge. Treasury Bonds Extend Surge. Consumer Discretionary Sector Breaks Down. Oil Extends Decline... Read More
Art's Charts May 30, 2019 at 10:08 AM
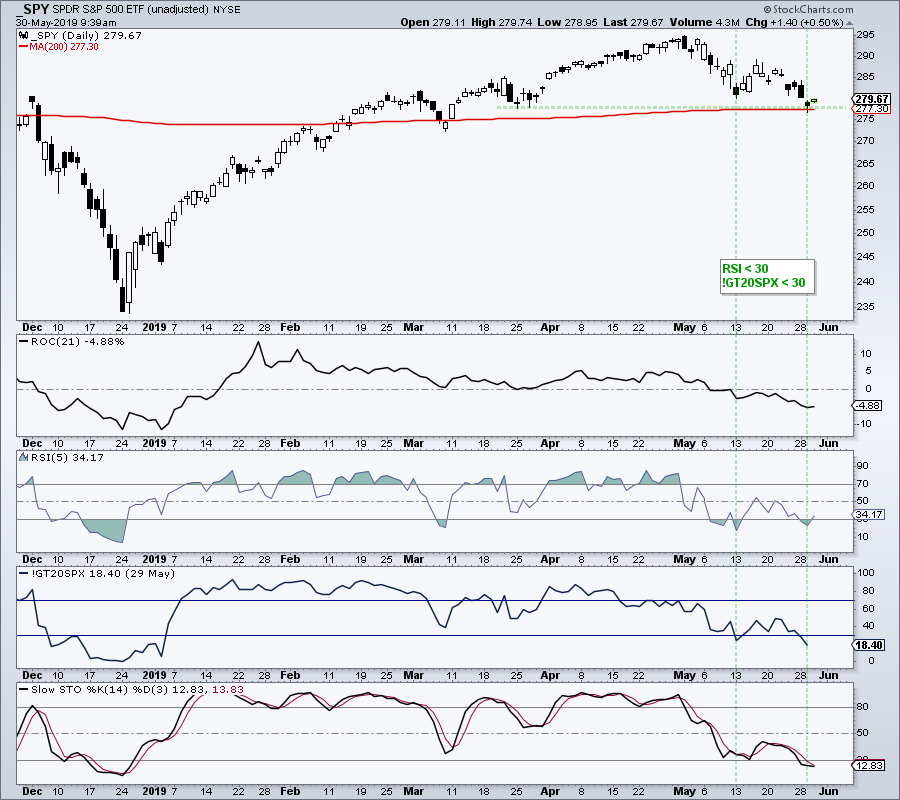
Oversold and at the 200-day. Pennant Evolves into Wedge. SOXX and Semis Hit Support. A Correction within Uptrend for PALL. ... Oversold and at the 200-day ..... Read More
Art's Charts May 29, 2019 at 06:25 AM
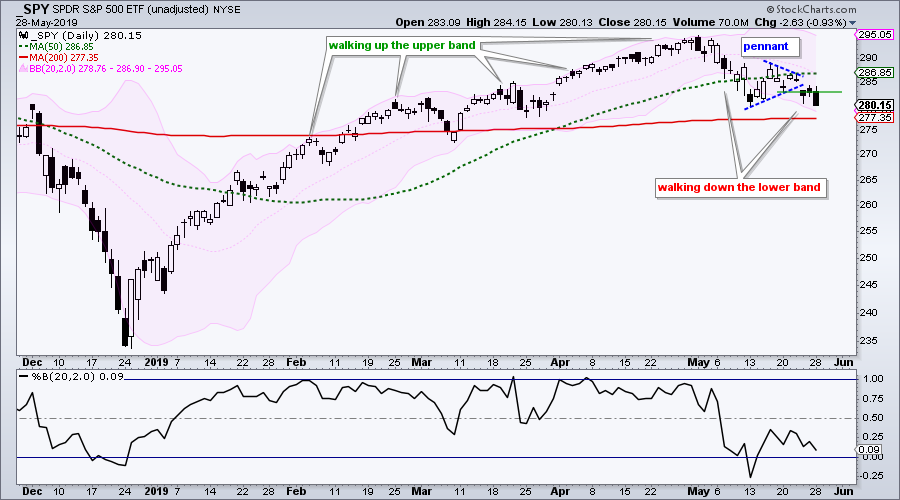
Walking Down the Lower Band. Swings are Getting Bigger. Selling Pressure Expands to Defensive Sectors. Bearish Breadth Thrust for XLP and XLV. On Trend on Youtube. ...Walking Down the Lower Band ..... Read More
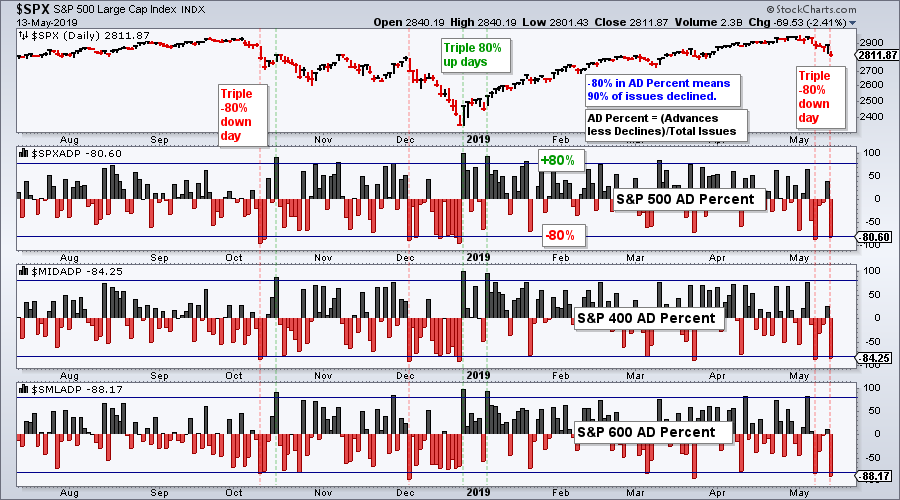
Art's Charts May 24, 2019 at 10:48 AM

Retail, Banks, Semis and Oil. S&P 500 Corrects with Bigger Uptrend. Index Breadth Table Remains Net Bullish. AD Percent Down Days Weigh in May. Small-caps Lead the Way Lower. Charts to Measure Risk On/Off. Sector Shift in May. Sector Breadth Table Remains Bullish... Read More
Art's Charts May 17, 2019 at 09:44 AM

Defensive Sectors Have Strongest Charts. Offensive Sectors Have Yet to Break Down. S&P 500 Gets a Bounce. A Bearish Failure Swing for the Russell 2000. Large-caps Lead New High List. Discretionary and Communication Sectors Take Hits. Housing versus Retail. Software versus Semis... Read More
Art's Charts May 14, 2019 at 07:49 AM
Triple 90% Down Volume Day. Breadth Table Update. Four Steps Up and One Step Back. SPY Hits Support and Becomes Oversold. Interest in Tariffs and Fed. Triple 90% Down Volume Day Stocks were hit with strong selling pressure again on Monday with the S&P 500 SPDR falling 2... Read More
Art's Charts May 10, 2019 at 09:47 AM

Small-caps and 3 Sectors Weigh. Everywhere and Nowhere. Immediate Trend is Still Up. Another Possible Support Zone. Index Breadth Table Survives 90% Down Days. Yield Spread Remains Positive for Stocks. Mean-Reversion Setup Brewing. Art's Charts ChartList Update. ..... Read More
Art's Charts May 08, 2019 at 08:07 AM
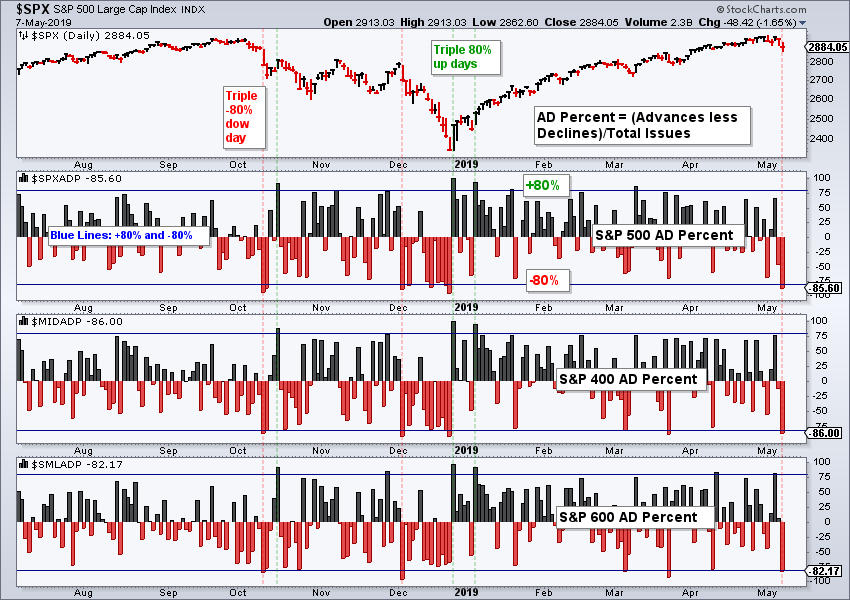
Triple 90% Down Day It is way too early to call for a major top, but we do have a short-term breadth signal that points to further downside. The chart below shows AD Percent for the S&P 500, S&P Mid-Cap 400 and S&P Small-Cap 600... Read More
Art's Charts May 03, 2019 at 09:34 AM