Art's Charts June 28, 2019 at 10:06 AM
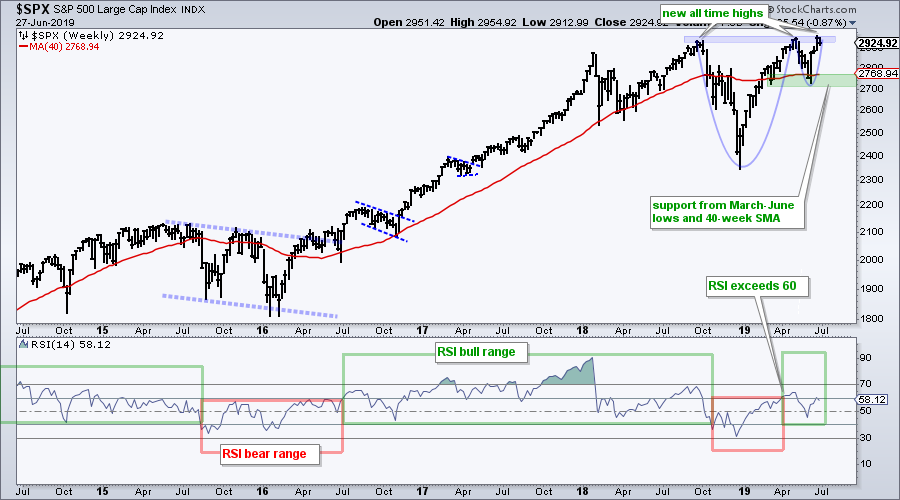
When Higher Highs are Expected. Small-cap Breadth Comes Alive. Sector Table Remains Firmly Bullish. ETF Leaders and Setups. Art's Charts ChartList Update. ... When Higher Highs are Expected ... Let's review the weekly chart for the S&P 500 first... Read More
Art's Charts June 26, 2019 at 10:13 AM

Strategy Recap. RSI Signal Examples. Aroon Signal Examples. Testing the Individual Signals. Selecting from Scan Results. ... Last week I showed a scan using RSI(65) and Aroon(65) to find stocks showing steady and consistent uptrends... Read More
Art's Charts June 21, 2019 at 10:10 AM

S&P 500 Affirms Weight of the Evidence. New Highs Expand Yet Again. Sector Table Improves with Two Bullish Signals. Healthcare and Technology Lead New High List. What if you already Knew....? Art's Charts ChartList Update. ... All Time High Means only One Thing ..... Read More
Art's Charts June 19, 2019 at 09:22 AM
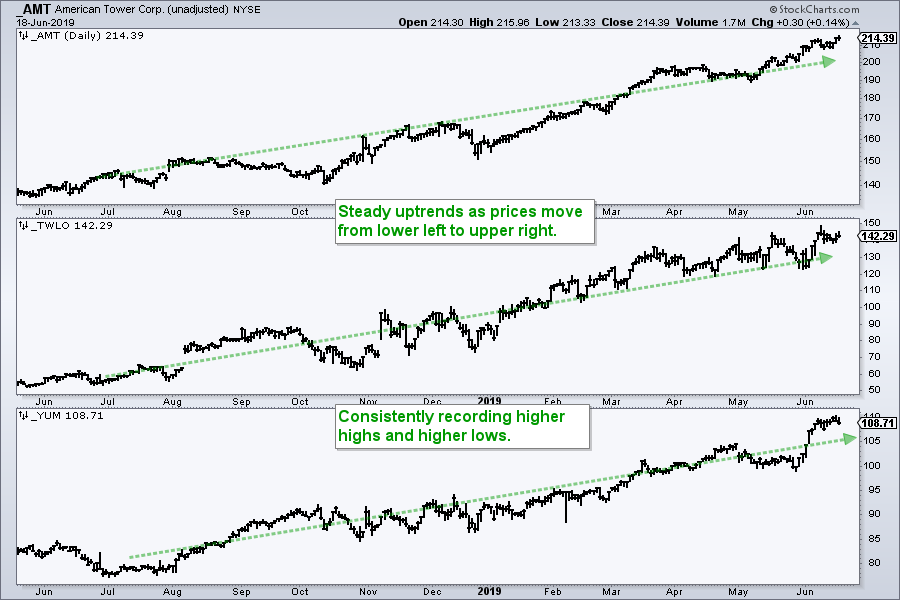
... As a trend-momentum kind of guy, my first task is to find stocks with strong uptrends and this starts with a scan. Chartists looking for scan ideas should first find several visually appealing price charts and then study these charts carefully... Read More
Art's Charts June 14, 2019 at 09:21 AM

The Long and Rocky Road. S&P 500 Maintains Bullish Bias. Index Breadth Table Improves. MDY and IWM Break Out of Wedges. Sector Breadth Table Gets Four New Signals. Healthcare Perking Up. Big Six Sectors Trigger Breakouts. Utes, REITs and Staples Remain Strong... Read More
Art's Charts June 13, 2019 at 06:16 AM
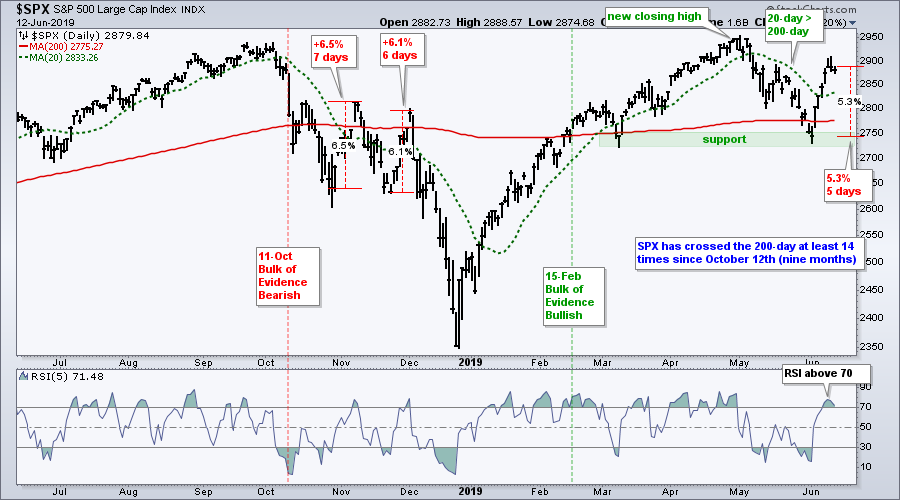
Long-term Uptrend Still Dominates. SPY Holds Wedge Breakout and 50-day. Biotech ETFs Firm in Reversal Zones. Chinese ETFs Diverge. Art's Charts ChartList. On Trend on SCCTV and Youtube. ... Long-term Uptrend Still Dominates ..... Read More
Art's Charts June 07, 2019 at 09:44 AM

Small-caps Still Lagging. S&P 500 Establishes Clear Support Zone. Breadth Falls Short and Fades. $SPX Close + 200-day SMA = NOISE! A Mixed, but Bullish, Indicator Table. Sector Table Remains Firmly Bullish. New Highs Surge within S&P 500. New Highs in Finance Sector... Read More
Art's Charts June 04, 2019 at 10:24 AM
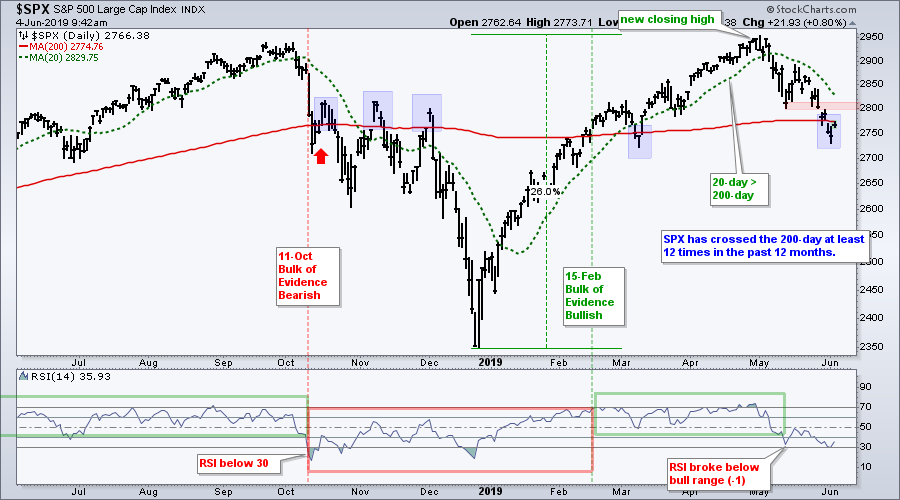
S&P 500 Crosses 200-day for Umpteenth Time. The S&P 500 versus a Slew of Negative Charts. Vietnam ETF Tests Breakout Zone. Frontier Markets ETF Nears Breakout. ... There sure is a lot of negativity out there as the S&P 500 toys with its 200-day SMA... Read More