Hello Fellow ChartWatchers!
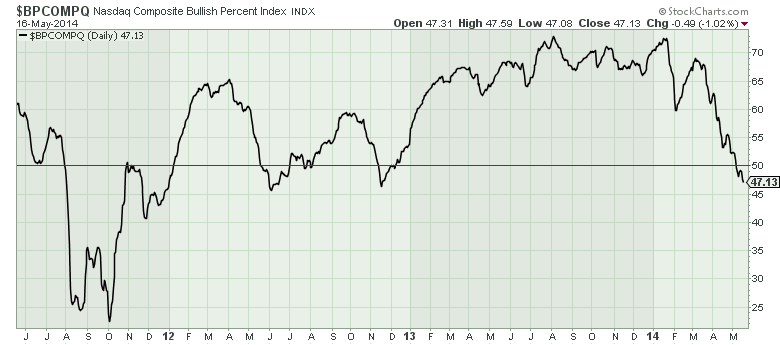
While the major averages were mixed last week with the Nasdaq up 0.5% and the Dow down 0.5%, in general the markets continued to weaken. Check out the Bullish Percent Index chart for the Nasdaq Composite:
It has continued to move lower even after crossing the 50% line. That doesn't bode well for Nasdaq stocks. For more, skip down to John, Arthur, Greg and Tom's articles. I, on the other hand, want to talk about something that is increasing in value...
All the New Things at StockCharts.com This Year
As long-time members know, we are constantly increasing the value of a StockCharts.com membership without increasing the price. The first half of this year has proved that point in dramatic fashion. Here's a (mostly) complete list of all the things you now have access to on StockCharts, that you didn't have on January 1st:
- Ranked Scan Results
- Sector & Industry columns in Scan results and Summary view
- The DecisionPoint Market Analysis Chart Gallery
- The "Zoom Thumbnail" chart option
- The DecisionPoint blog by Erin Heim
- Five DecisionPoint ChartPacks
- The Quarterly Updates to Gatis Roze's "Tensile Trading" ChartPack
- Martin Pring's Special K technical indicator(*)
- DecisionPoint Tracker Reports
- DecisionPoint Market Recap Reports
- "Difference" Ticker Symbols(*)
- $SECTOR and $INDUSTRY pseudo symbols(*)
- SCTR values for many more stocks
- The interactive "Ranger" control for setting start and end dates
- Auto-Refreshing Summary View
- "Top Advisors Corner" blog
- Over 1300 new DecisionPoint Market Indexes
- Verbose Chart Legends
- 5 New SharpChart Color Schemes
- The DP Price Momentum Oscillator (PMO)
- More Educational Videos
- Online version of John Murphy's "Charting Made Easy" book
- Updated "Blogs" page layout
- Column Sorting and Hiding for Scan Results and Summary view
- CandleGlance Charts sorted by Indicator value(*)
- "Price Up/Down Pair" Indicator
- Martin Pring's "Market Roundup" Blog(*)
- Carl Swenlin's "DecisionPoint Daily Update" Blog
- "Events" overlay to show data adjustment points on each chart
- Additional Historical Data for many commodity indexes(*)
- ...and no doubt several things that I'm forgetting
(The ones marked with an asterisk are brand new features added within the last 2 weeks.)
All of these items have been added to the site since January 1st without any changes to our pricing. Think about that for a second. What other web site or software service do you know of that has continually added new features at this same rate? Our philosophy is that we always want to be increasing the VALUE of your StockCharts.com membership. We have consistantly demonstrated that throughout our history - which goes back over 15 years now - however this recent stretch of 4.5 months may have seen our biggest rate of functionality improvements ever. And we're aren't stopping now - look for another new, major charting tool to be added to our website in the coming weeks as well as two new exciting bloggers and much more.
And, no, all you cynics out there, there are currently no plans to change our pricing for the foreseeable future.
Enjoy!
- Chip


